Alert policy analyzer Labs
The alert policy analyzer simulates how an alert policy would have behaved against an SLO's historical data. Use it to tune alert conditions before they go live, calibrate sensitivity, standardize policies across teams, and refine alerting after an incident.
Alert policy analyzer is a Nobl9 Labs feature. The interface, limits, and behavior may change before general availability.
What the analyzer does
For one objective on one SLO, over a historical interval you choose, the analyzer:
- Replays the alerting engine using a single alert policy you provide.
- Returns the alerts that the policy would have produced over the interval.
- Plots the remaining error budget and the alerting measurement for each condition in the policy.
Results persist and are reachable by their unique URL, so you can share them with teammates.
Prerequisites and availability
Supported SLO types
The analyzer supports:
- Standard SLOs
- Composite SLOs
If an SLO isn't supported, the entry point on its details page is hidden.
Permissions
You need the view permission on the SLO's project. This is the same permission required to open the SLO details page.
Limits
| Limit | Value |
|---|---|
| Concurrent analyses per organization | 5 |
| Maximum analysis interval | 31 days |
| Historical data range | Up to 2 years |
| Objectives per analysis | 1 |
| Alert policies per analysis | 1 |
The SLO must have historical data for the interval you choose. If Replay hasn't backfilled the period, the analyzer reports a successful run with no data.
The analyzer evaluates the alert policy against the error budget that was already calculated for the chosen interval. Any budget adjustments that applied at that time are already reflected in the budget the analyzer sees. No adjustment events are re-applied during the simulation.
Running an analysis
Start from SLO details
- Open the SLO you want to analyze.
- In the SLO detail header, click More actions.
- Select Analyze alert triggers.
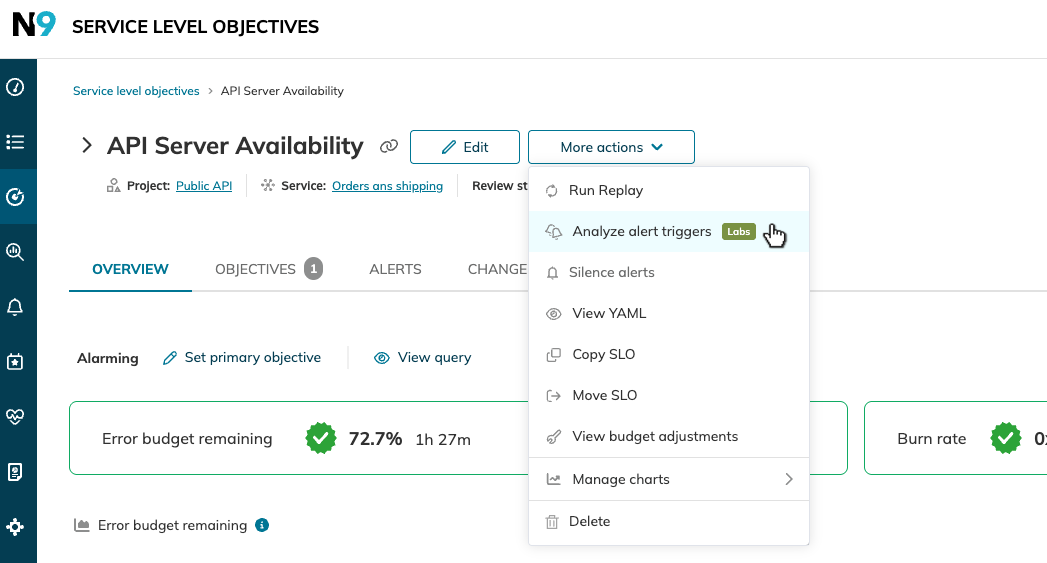
The analyzer opens as a three-step wizard.
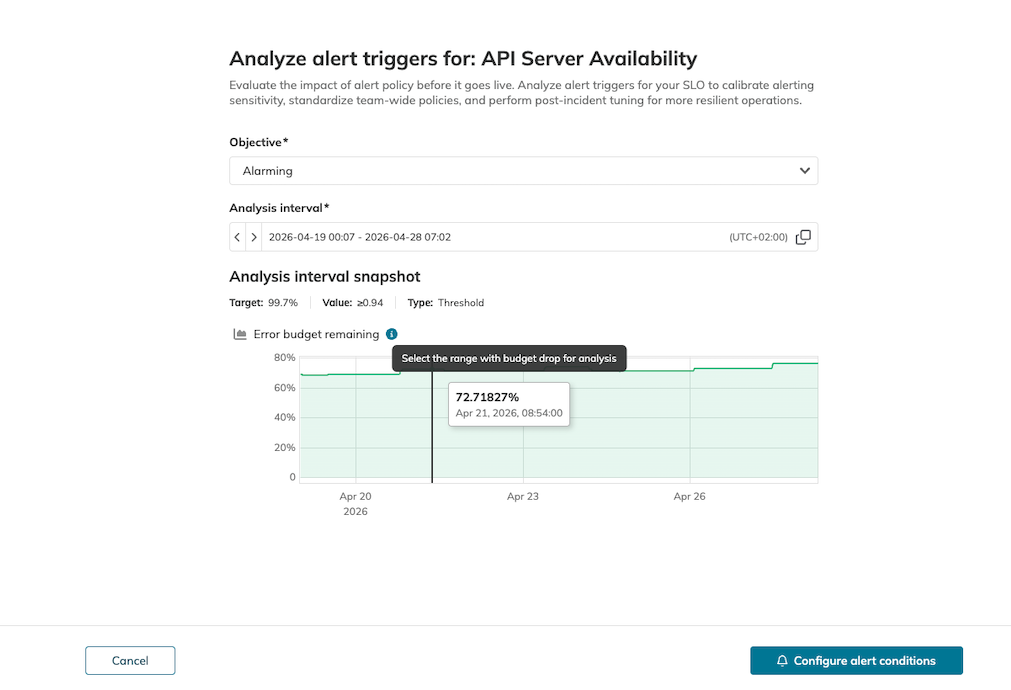
Step 1: Objective and analysis interval
Pick the objective to analyze and the analysis interval—the historical range the analyzer will replay alert policy logic against.
- Each analysis covers exactly one objective.
- The interval can be at most 31 days.
- Timestamps in the interval picker, charts, and results all use the SLO's display time zone.
The analysis interval snapshot shows the objective's target, value, and type, with an Error budget remaining chart for the selected interval. Use it to locate a range with a meaningful budget drop before moving on.
Step 2: Alert policy conditions
Choose how to provide the alert policy under test by selecting a condition reference:
- Auto-fill from time range: Nobl9 generates a starting alert policy based on the budget drop observed over the chosen interval.
- Alert policy preset: start from one of the standard Nobl9 alert policy presets.
- Existing alert policy: load the conditions and cooldown of any alert policy you can read in your organization, from any project.
After picking a starting point, edit the conditions and cooldown to match what you want to test. Use Add condition to add another condition, or Reset to default to discard your edits. Edits stay local to this analysis and don't modify the source preset or alert policy.
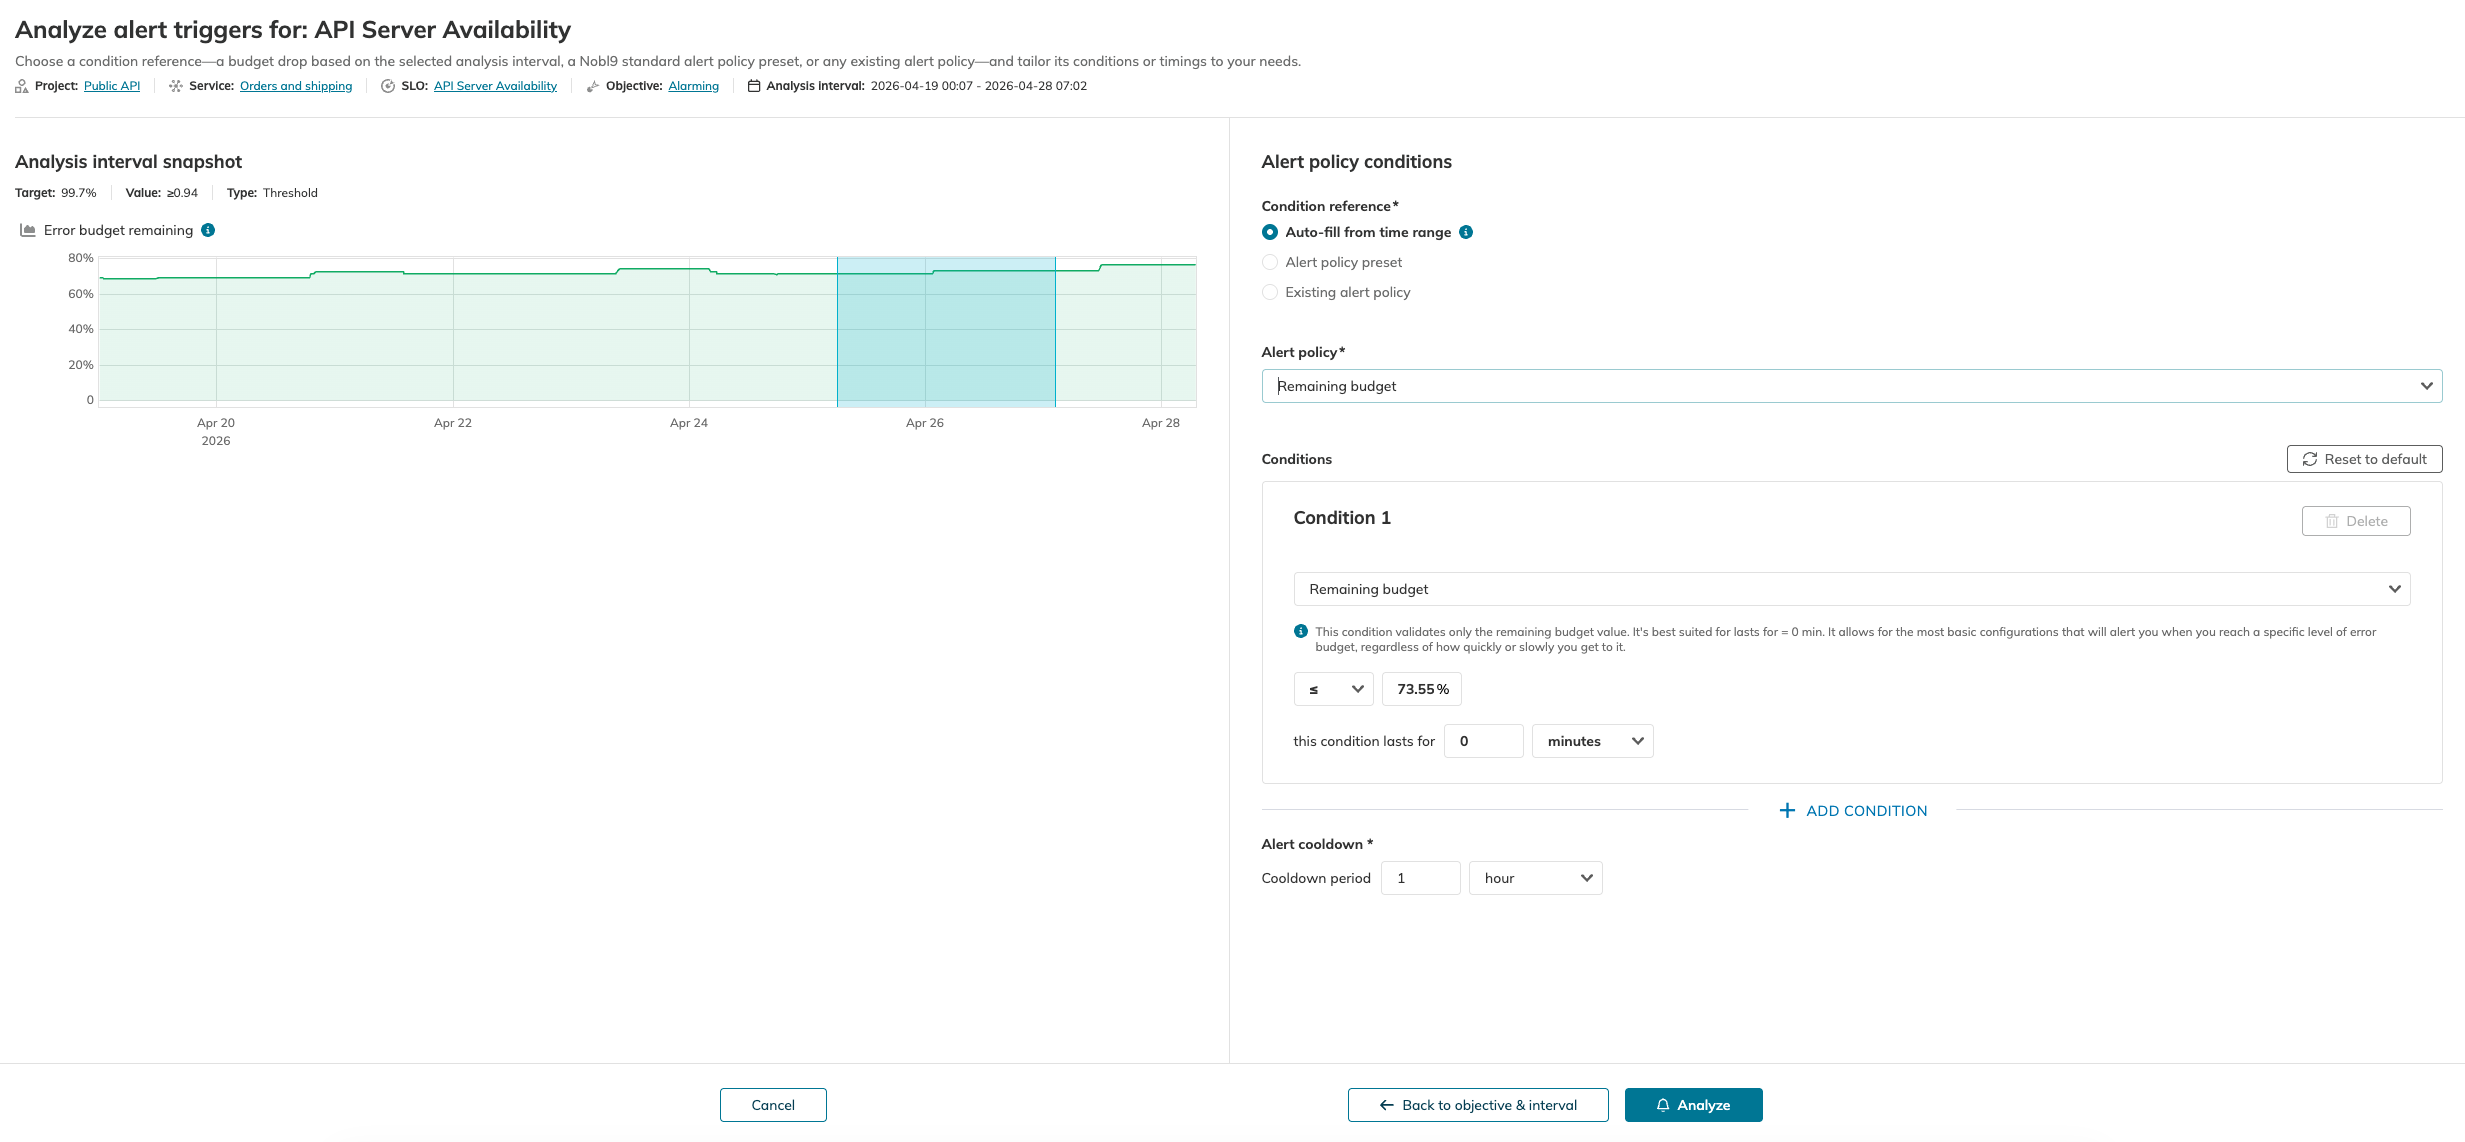
Click Analyze to run the simulation. Use Back to objective & interval if you need to change the objective or interval.
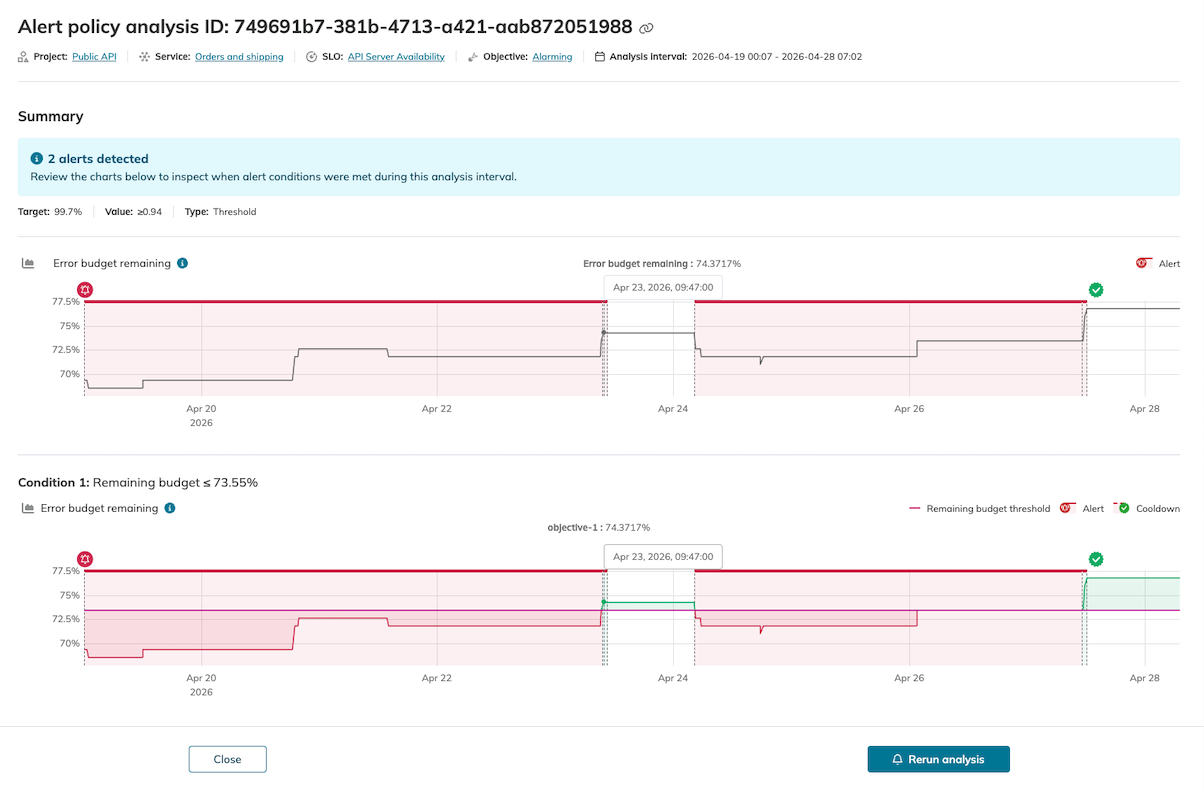
Step 3: Review the simulation
The simulation step polls the analysis until it completes. The current state is shown next to the Alert policy analysis ID. See Analysis statuses.
A completed analysis shows:
- A Summary section with the number of alerts detected and the objective's target, value, and type.
- An Error budget remaining chart for the interval, with markers for alerts.
- One chart per alert condition, labeled with the condition (for example,
Condition 1: Remaining budget ≤ 73.55%).
Use the link icon next to the analysis ID to copy the analysis URL. Click Rerun analysis to start a new analysis from the same starting point, or Close to exit.
Reading the results
Error budget remaining chart
Always shown, regardless of which conditions the policy contains. Alerts are marked on this chart only when the alert was triggered, resolved, and the cooldown has started—matching the alert lifecycle on the alert details page.
Per-condition charts
The analyzer renders one chart per condition in the policy. Each chart plots the alerting measurement appropriate for the condition type and alerting window, using the same logic as the alert details page. The legend shows the threshold (for example, Remaining budget threshold), Alert markers for when the condition was satisfied, and the Cooldown band that follows each resolved alert.
Analysis statuses
While the analysis runs, it moves through these states in order:
Exporting time series data → Calculating alert metrics → Evaluating alert conditions → Storing alert results → Creating analysis version → Downsampling time series data → Updating time series → Finalizing analysis → Analysis complete
Two terminal failure states can also appear:
- Analysis canceled: the run stopped before it finished.
- Analysis failed: the run did not complete. Start a new analysis from the SLO details page.
Sharing analysis results
Each analysis has its own URL. Anyone in your organization with view access to the SLO can open the URL and see the same results. Keep the URL if you want to refer back to a run later.
Known limitations
- No history of past analyses. There is no list view, so save the analysis URL if you need to return to it.
- Empty results aren't always failures. If the SLO didn't collect data for the interval, or if the policy's conditions never fire on the historical data, the analyzer reports a successful run with zero alerts.
- No replay coordination. The analyzer does not check for in-progress Replay jobs. If Replay is still backfilling the interval you select, results may be incomplete; rerun the analysis once Replay finishes.

