Test metric
Test metric lets you preview raw SLI data for a metric query before you create or update an SLO. Use it in the SLO wizard to catch query, authentication, and data availability issues early.
Scope of support
Test metric is available for the following data sources:
| Data source | Minimum agent version |
|---|---|
| Amazon Prometheus | 0.114.4 / 0.114.0-beta |
| Azure Monitor | 0.114.0-beta |
| Azure Monitor managed service for Prometheus | 0.114.0-beta |
| Dash0 | 0.113.0-beta |
| Dynatrace | 0.114.4 / 0.113.0-beta |
| Elasticsearch | 0.114.4 / 0.114.0-beta |
| Google Cloud Monitoring | 0.114.4 / 0.114.0-beta |
| LogicMonitor | 0.114.0-beta |
| Prometheus | 0.114.4 / 0.114.0-beta |
| Splunk | 0.114.4 / 0.113.0-beta |
| Splunk Observability | 0.114.4 / 0.113.0-beta |
| Sumo Logic | 0.114.4 / 0.113.0-beta |
| ThousandEyes | 0.114.4 / 0.114.0-beta |
| Zscaler | 0.115.0-beta |
The Minimum agent version column applies to data sources connected using the agent method.
The Open metric test action appears only for data sources and metric definitions that support this feature.
How it works
Open Test metric from the metric query fields in the SLO wizard. For new SLOs, you can use it when you select a data source and metric, and when you define error budget calculation and targets. For existing SLOs, use it when you update objective queries.
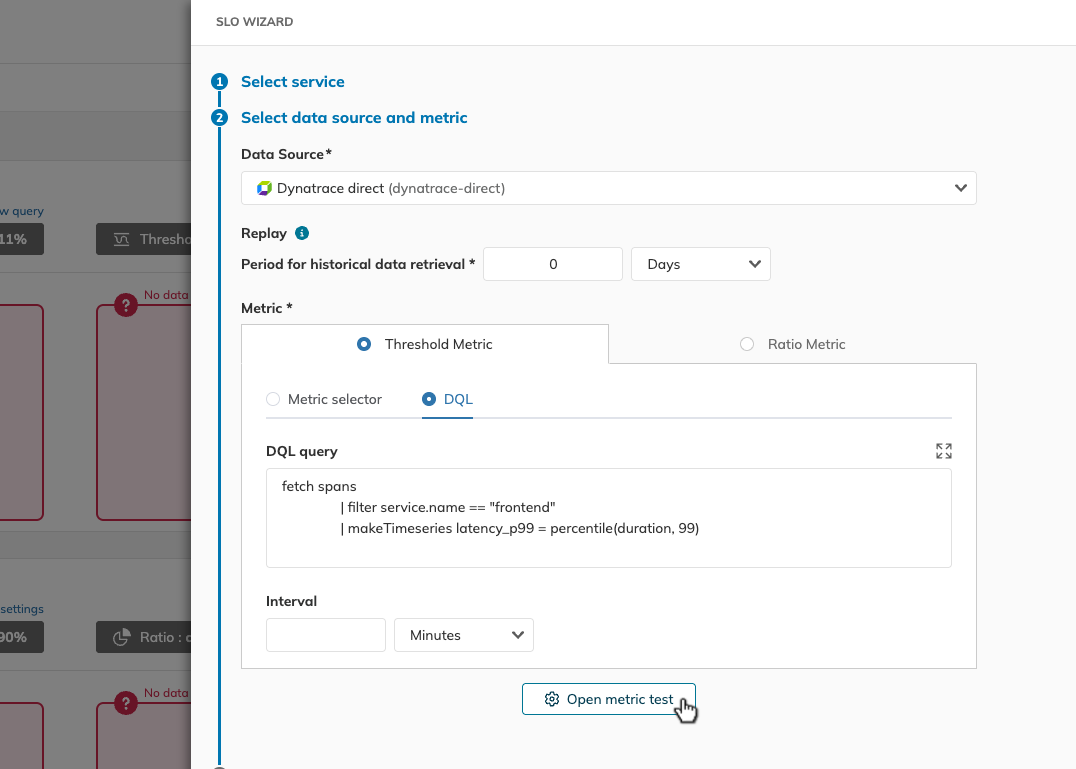
To test a metric:
- Click Open metric test.
- Choose 15 minutes or 1 hour as the testing period.
- Click Test metric.
Nobl9 queries the selected data source for the chosen time window and shows the raw SLI values returned by the data source. After the first test, changing the testing period runs the test again for the new time range.
Reading results
When the query succeeds, Test metric displays the raw data over the selected time window.
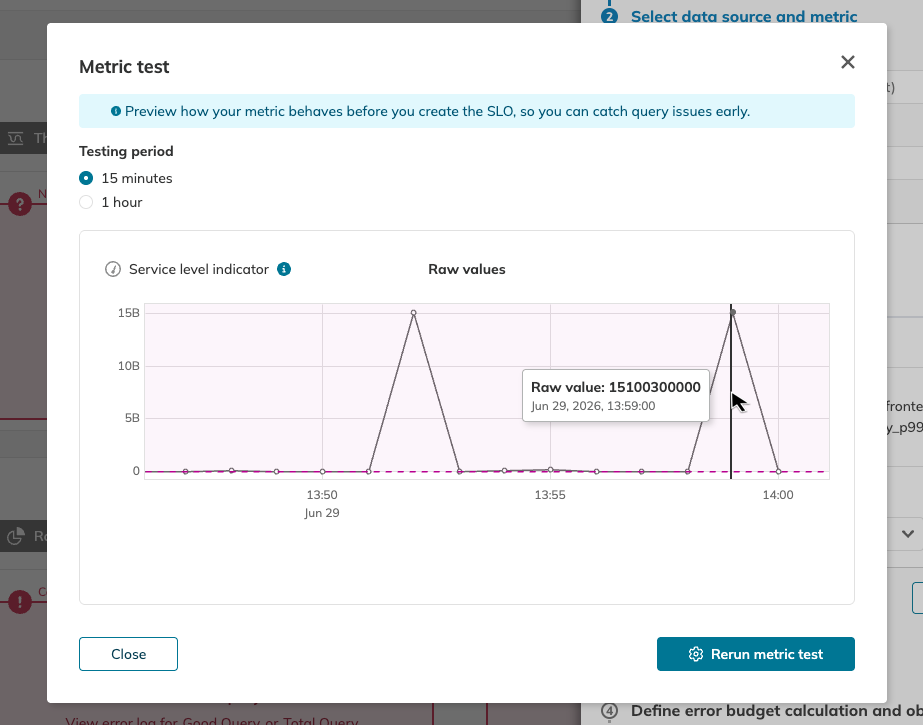
Use the chart to confirm that the query returns values in the expected range and that the selected data source has data for the period you tested. Empty results can mean that the query is valid but the selected data source has no data for the tested time window.
For ratio metrics, Nobl9 shows the returned good, total, and delta values when they apply to the metric configuration.
When the query fails, Test metric displays the Data source error message returned by the data source. Use this message to adjust the query, credentials, or data source configuration, then run the test again.
For agent-based data sources, detailed errors may be available in agent logs. To avoid exposing sensitive data, Nobl9 does not send data source error details to the platform.

