Data anomaly detection
Data anomalies highlight unusual patterns that may affect how you interpret your SLO. Some indicate missing or inconsistent data; others reflect intentional changes in how you collect it. An anomaly doesn't necessarily mean your service is unhealthy or your error budget is wrong.
Nobl9 offers two ways to detect data anomalies:
- Manually configured detection of no data. It is available for everyone—you set up notifications for your SLO. These notifications trigger when this SLO stops reporting data for a duration you set.
- Automatic data anomaly detection. This is an advanced feature for the Nobl9 Enterprise Edition. It detects several data anomaly types automatically using centralized defaults that can be customized on demand. See support by SLO type.
Once a data anomaly is detected, Nobl9 updates the tile on this SLO details page and creates an SLO annotation with details about the data anomaly and a link to the affected SLO.
Manual configuration and auto-detection both operate fully and seamlessly alongside each other.
This overview explains how data anomaly detection is configured and links to a dedicated page with examples and troubleshooting steps for each anomaly type.
No data manual configuration
With manually configured No data anomaly detection, you're setting up notifications for no data. The notifications are sent using one of the supported alert methods. Ensure you have access to at least one of the following:
For ServiceNow, Nobl9 can also send a closing event when the no-data anomaly resolves. Enable Alert resolution on the ServiceNow alert method to receive these events. For event fields and YAML settings, see ServiceNow no-data anomaly notifications.
You can set up data anomaly detection:
- In the SLO wizard within the Nobl9 Web application
- Applying an SLO YAML definition with
sloctl apply - Using the Nobl9 Terraform provider
The settings in this section apply only to manually configured No data anomaly alert notifications for a specific SLO. They do not change Nobl9's automatic data anomaly detection in SLO oversight. In particular, automatic No data anomaly detection continues to use its own centralized rules and defaults.
- Nobl9 Web application
- sloctl
- Nobl9 Terraform provider
To configure data anomaly detection in the Nobl9 Web application, select No data anomaly alert in Step 5 of the SLO wizard. Then, specify how long your SLO must wait for data before sending the notification, select your preferred alert method, and, if needed, enable Treat zero as no data.
When this option is enabled, zero-valued points are treated as no data for this manual no-data alerting flow.
Leaving it unchecked preserves the default behavior.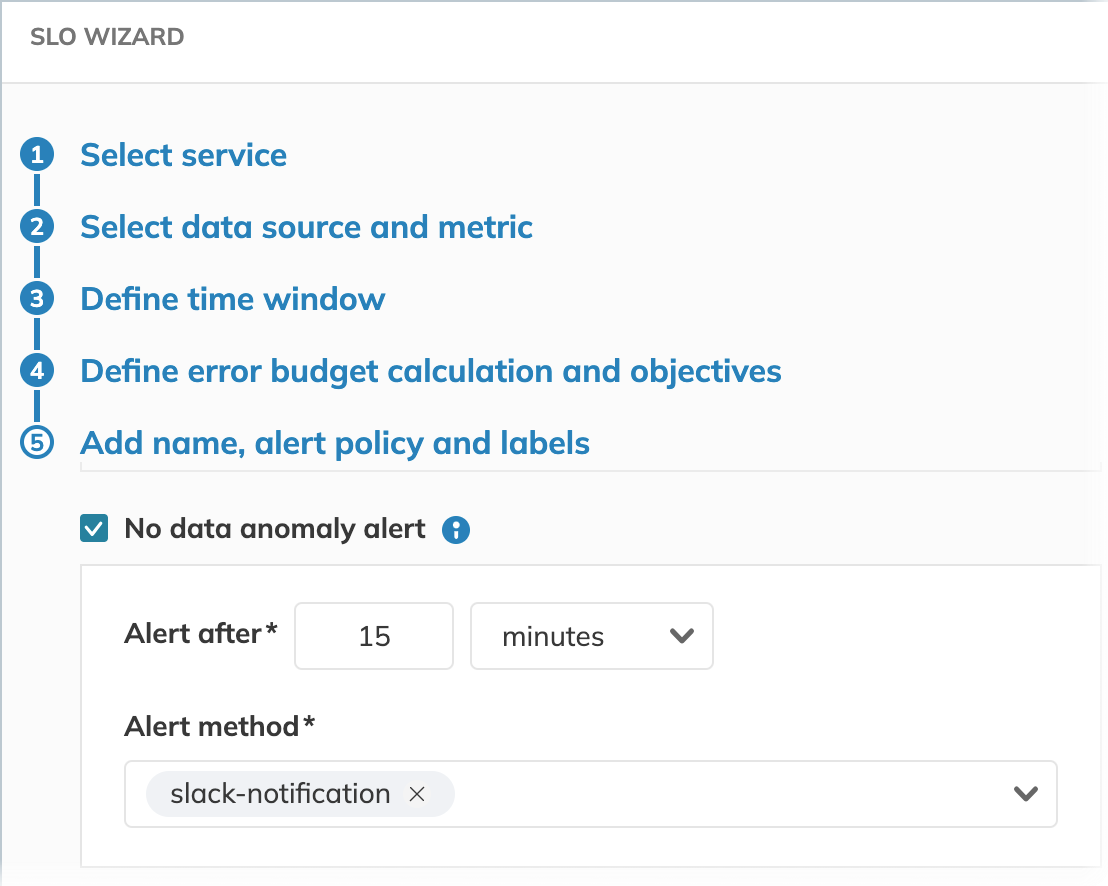
To set up data anomaly detection using sloctl, configure the noData parameters in your SLO YAML definition:
- apiVersion: n9/v1alpha
  kind: SLO
  metadata:
    name: my-slo
    project: my-project
  spec:
    alertPolicies: []
    anomalyConfig:
      noData:
        alertMethods:
          - name: my-alert-method-1
            project: my-project-1
          - name: my-alert-method-1
            project: my-project-2
        alertAfter: 1h
        treatZeroAsNoData: true
Set treatZeroAsNoData: true to treat zero-valued points as no data for this manual no-data alert.
If you omit this field or set it to false, the default behavior remains unchanged.
Then, apply it with sloctl apply.
To set up data anomaly detection using Nobl9 Terraform provider, follow the below pattern:
[...]
   anomaly_config {
      no_data {
        alertAfter = "15m"
        treat_zero_as_no_data = true

        alert_method {
          name = "my-alert-method-1"
          project = "my-project-1"
        }

       alert_method {
         name = "my-alert-method-2"
         project = "my-project-2"
       }
     }
   }
Use treat_zero_as_no_data = true to enable the same behavior in Terraform.
If you leave it unset or set it to false, zero-valued points are handled with the default behavior.
- You can add up to five alert methods for your manual no data anomaly notifications per SLO
- To receive notifications for no data anomalies, you must have access to both the SLO and the alert method it uses
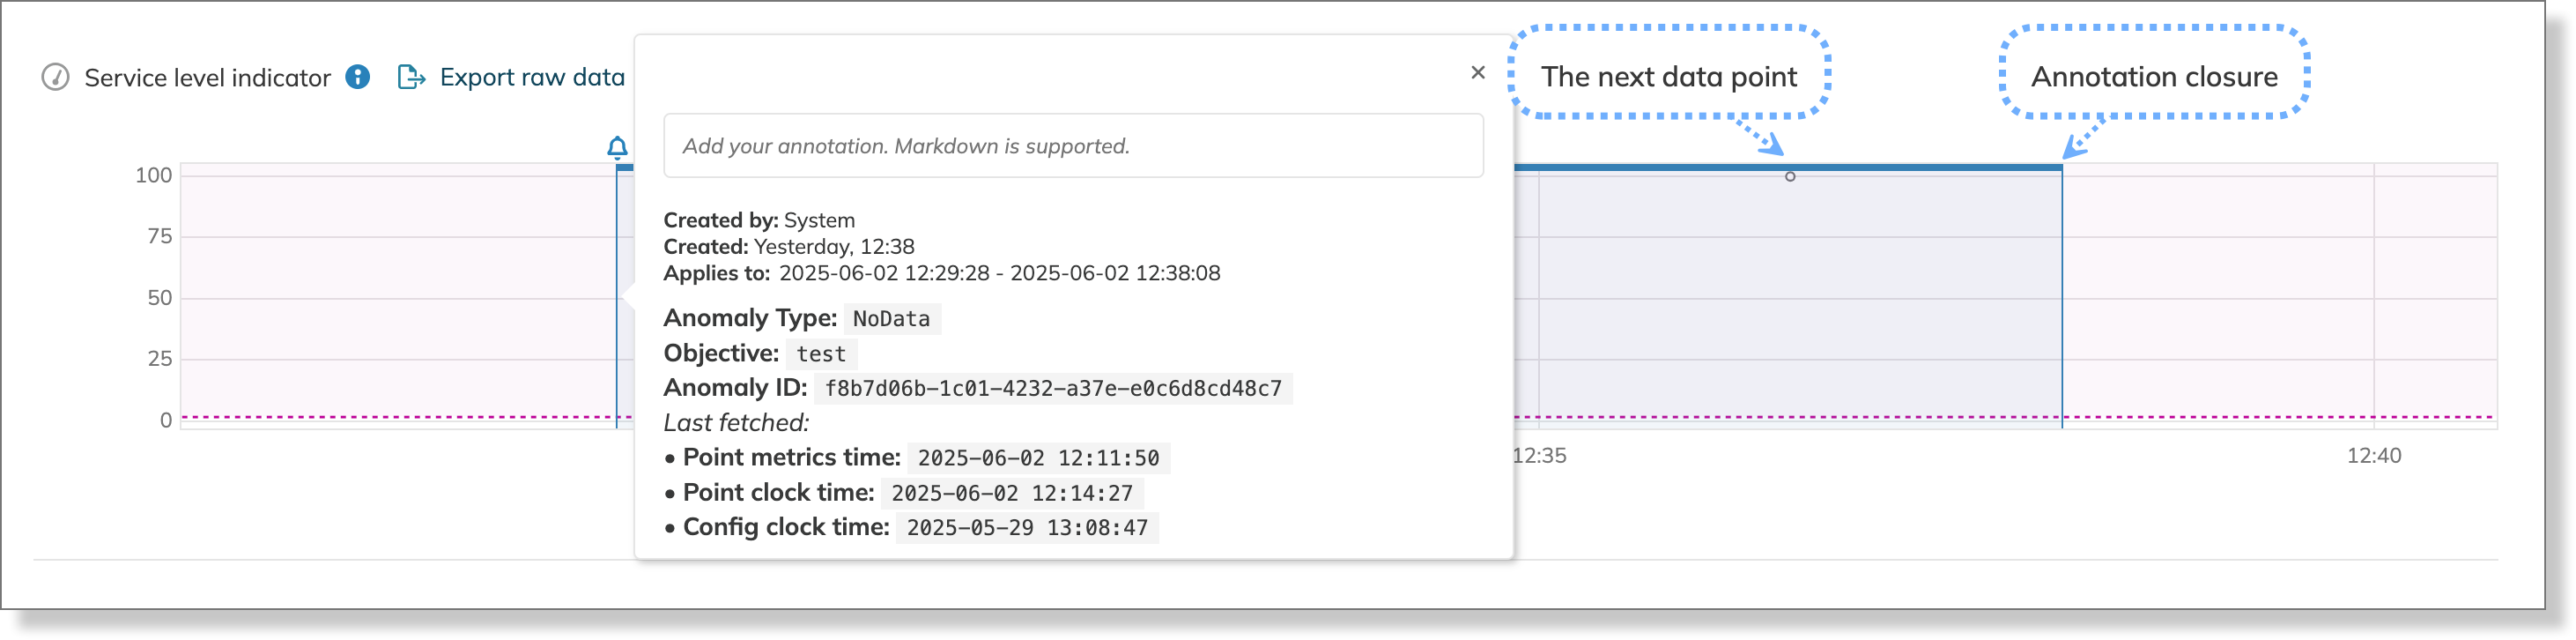
- Query parameters, like query delay, can affect when Nobl9 sends notifications for missing data and the duration of the corresponding annotations. This creates a difference in timestamps: SLO charts use the time from the data source, while notifications and annotations are based on when Nobl9's query confirms the anomaly.
| Data point | Time in a data source | Time in Nobl9 | No data anomaly detection time |
|---|---|---|---|
| Last data point before no data period | 13:00:00 | 13:05:00 | 13:15:00 |
| First data point after no data period | 14:00:00 | 14:05:00 | 14:15:00 |
Data anomaly auto-detection Enterprise
Automatic data anomaly detection is available exclusively in the Nobl9 Enterprise Edition
The following data anomaly types are detected:
| Data anomaly | Description | Default waiting time | Default cooldown |
|---|---|---|---|
| No data | No data is being reported by an SLO objective for one week | 1 week | No cooldown |
| Constant burn | An SLO objective is constantly burning its error budget for an unusually long time | 1 week | 30 minutes |
| No burn | An SLO objective is not burning its error budget for an unusually long time | 8 weeks | No cooldown |
| Incremental mismatch | A ratio SLO, configured with the incremental data count method, has received a non-incremental data point | Triggered immediately | 1 day |
| Good over total | The good event count for a ratio SLO exceeds its total event count for the same calculated interval | Triggered immediately | 30 minutes |
| Sampling rate mismatch | The two streams of a count-metric ratio SLO report points at substantially different rates | Warmup and confirmation | No fixed cooldown; recovery confirmation applies |
| Sampling rate change | An SLI stream reports points at a substantially different rate from its learned baseline | Warmup and confirmation | No fixed cooldown; recovery confirmation applies |
Contact Nobl9 Support to adjust these settings for your organization.
Support by SLO type
Automatic data anomaly detection applies to standard SLOs, not composite SLOs. For a composite, inspect the standard SLOs that make up its components. An anomaly on a component does not create the same anomaly on its parent composite.
| Automatic anomaly | Eligible standard SLOs | Composite SLOs |
|---|---|---|
| No data | Threshold and ratio SLOs | Not supported |
| Constant burn | Threshold and ratio SLOs | Not supported |
| No burn | Threshold and ratio SLOs | Not supported |
| Incremental mismatch | Ratio SLOs with incremental count metrics | Not supported |
| Good over total | Ratio SLOs with good and total count metrics | Not supported |
| Sampling rate mismatch | Ratio SLOs with good and total or bad and total count metrics | Not supported |
| Sampling rate change | Threshold SLOs with raw metrics and ratio SLOs with count metrics | Not supported |
This table covers automatic anomaly detection. Manually configured No data notifications are a separate feature.
No data
Automatic No data detection finds objectives that stop reporting points for an extended period. Its default observation period is one week.
Read how the No data anomaly works, including a timeline and troubleshooting steps.
Constant and no burn
Constant burn and No burn examine opposite long-running error budget patterns:
- Constant burn means the objective continuously consumes error budget.
- No burn means the objective does not consume error budget for an unusually long time.
While we do our best to help you identify misconfigurations, the range of potential causes is too extensive to guarantee that all data anomalies are solely due to misconfigurations.
That is why a Constant burn data anomaly may be triggered by an actual incident on your system side, instead of a misconfiguration.
Similarly, for No burn, most cases should point to misconfigurations; however, some data anomalies may be produced for a normal, healthy SLO that simply has not burned its error budget.
Treat data anomalies as hints rather than definitive signals that demand an immediate response.
Incremental mismatch
Incremental mismatch detects a non-zero decrease in a count metric configured as incremental. A point at zero is treated as an explicit counter reset.
Read how the Incremental mismatch anomaly works, including reset behavior and examples.
Good over total
Good over total checks whether good events exceed total events in an interval. Incremental SLOs with good and total count metrics allow a recent total lead to explain delayed good events within a one-minute catch-up window by default. Non-incremental SLOs with good and total count metrics report the anomaly immediately. Objectives configured with bad and total count metrics are not evaluated for this anomaly.
Read how the Good over total anomaly works, including catch-up examples and the effect on reliability.
Sampling rate mismatch
Sampling rate mismatch compares how frequently the two streams of a count-metric ratio objective report samples. It uses the spacing between sample timestamps, not the event counts stored in those points. For example, good can report four samples per minute while total reports only one.
Read how the Sampling rate mismatch anomaly works, including comparison charts, warmup, and recovery.
Sampling rate change
Sampling rate change compares each SLI stream's recent sampling rate with its learned baseline. A change from four samples per minute to one can trigger it even though data continues to arrive. The anomaly can resolve at the new rate as the baseline adapts.
Read how the Sampling rate change anomaly works, including point-spacing charts, rate changes, and baseline adaptation.
Data anomalies vs. alerts
While both data anomalies and alerts can create annotations on an SLO objective, they are distinct concepts with different purposes and configurations. The following table summarizes their key differences.
| Parameter | Data anomaly | Alert |
|---|---|---|
| Definition | An automatically detected deviation from expected data patterns, common to all SLOs | A user-defined notification triggered when specific, configured conditions are met |
| Focus | The integrity of incoming data | SLO's error budget or error budget burn rate |
| Trigger | Built-in system logic that analyses data patterns | A specific, user-configured alert policy |
| Rules | System-defined and cannot be changed by the user | Customizable by the user |
| Notifications | Doesn't send notifications using alert methods Except for manual No data anomalies | Sends notifications using configured alert methods |
| Silencing | Cannot be silenced | Can be silenced based on user configuration |
Manually configured No data detection rule follows the same logic as the auto-detection rule but must be enabled for an SLO explicitly and allow you to customize the waiting time and choose a specific alert method for notifications.
Useful links

 Query delayNobl9 featuresData anomaly troubleshootingFAQ & troubleshootingSLOs troubleshootingFAQ & troubleshootingData source troubleshootingFAQ & troubleshootingNetwork connectivity requirementsData sources: requirementsPermissions and accessRequirements