Nobl9 application (1.65.1)
- Set custom calendar-aligned time ranges in reports
- View historical time ranges in SLO History and Reliability roll-up report
- Improved the accuracy of ratio-based SLOs
- Handling sparse metrics in rolling time windows for the occurrences method
- Data presentation on SLI charts
- Editing SLOs without losing history
- Editing Composite SLOs without resetting charts
- More precise statistical data in SLI Analyzer
- High-level vulnerabilities
- Creating new SLOs with pre-existing names
Release details
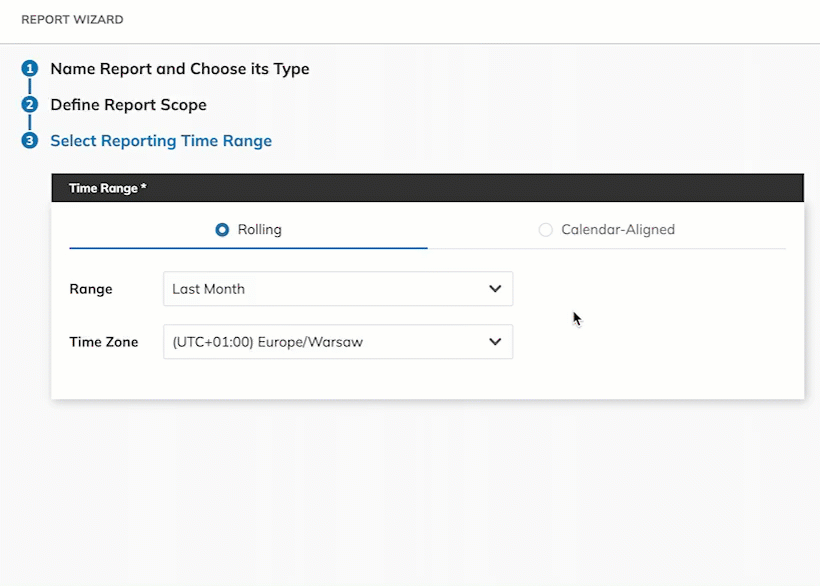
new Changes in reports
Historical and custom time ranges in reports
You can now explore historical time ranges in reports (for rolling and calendar-aligned range types):
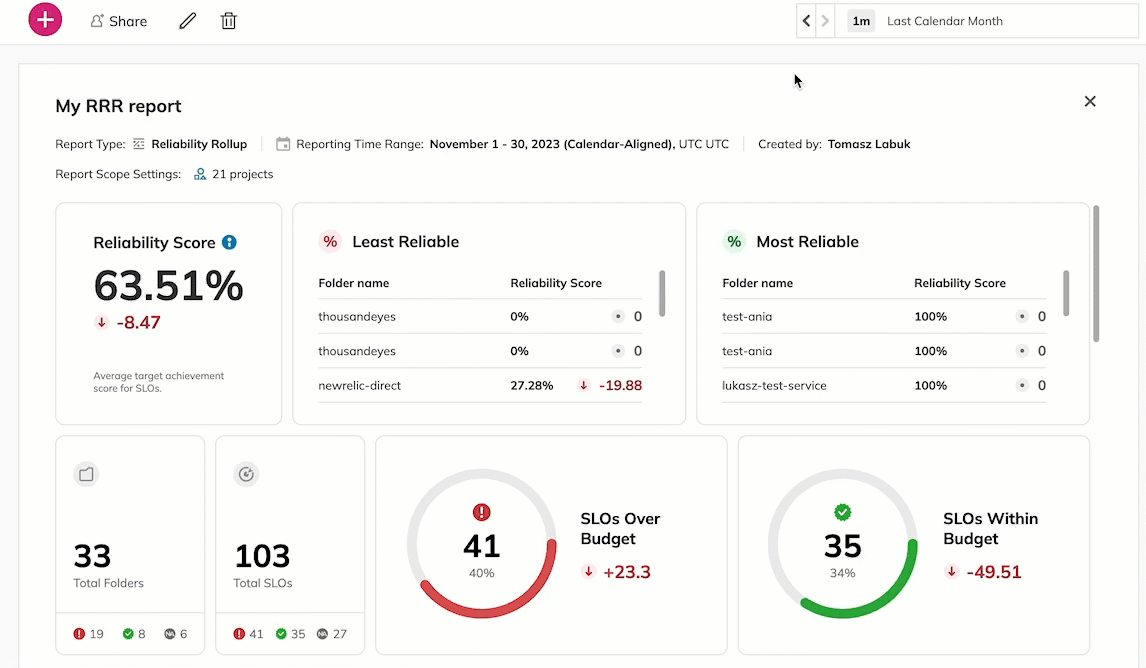
For the calendar-aligned range types, you create reports tailored to custom ranges:
With these changes, reports now offer full functionality, and we plan to phase out the old reports system entirely in the upcoming 1.66 release. Check the release announcement post for more details.
improved Improved data accuracy
Improved accuracy for ratio-based SLOs
To create a ratio-based SLO, Nobl9 needs two input streams of data as SLI: one for a good metric count (or bad in some cases) and the second for a total metric count. Usually, an individual API call is required to pull each data stream from the data source.
However, error budget calculations can be inaccurate if any API call fails or returns a metric based on an updated data set. The possible inaccuracies range from marginal (~0.001%) to significant when the error budget exceeds 100%. The range depends on the SLO parameters and the accumulated pull of SLI data. 1.65.1 version shields Nobl9 against such inaccuracies. Check the Nobl9 guide on SLO calculations if you want to learn more.
Handling sparse metrics in rolling time windows for the occurrences method
When you set up an SLO using the Occurrences budgeting method and a rolling time window, Nobl9 effectively manages situations where data points are less frequent than 1 minute.
In these situations, the system accurately calculates and presents the error budget burn down and burn rate on the graphs in the SLO details. This improvement ensures you receive precise insights even when data points occur less frequently than once per minute.
More precise statistical data in SLI Analyzer
We've shifted from using sample-based calculations for standard deviation and variation to population-based methods, which are better suited for analyzing entire datasets. These changes will be reflected in the charts, providing more accurate insights across the board.
improved Usability improvements in SLI charts
Improved data presentation on SLI charts
With this release, we've optimized how Nobl9 displays aggregated data points in charts for better clarity. This update significantly improves the chart experience for extended time windows. Now, Nobl9 can display SLI percentile data for up to two years without any performance issues, albeit with slightly reduced precision. Check this document to see real-time examples.
Improved showing data gaps for count metrics
We've also changed how gaps in data are displayed on SLI charts for count metrics. Previously, Nobl9 added artificial data points set at 0 to indicate gaps in count metric data for visualization purposes. Our recent updates let you quickly pinpoint periods on the SLI charts where your count metric SLOs did not record any data. Check this document for a detailed description of all related changes.
improved Improved UX for editing and creating new SLOs
Editing SLO threshold values
You can now edit your SLO's threshold value without losing the SLO's objective's history.
Editing Composite SLOs without resetting charts
From now on, you can edit burn rate values in Composite SLOs without resetting charts.
Creating new SLOs with pre-existing names
Previously, if you created an SLO, deleted it, and then created a new one using the same name, the charts would display historical data unrelated to the current SLO's history. With the latest updates, charts will accurately show data associated with the new SLO's history. Check this document for more details.