Nobl9 application (1.166.0)
Release details
new Nobl9 Alerts mobile
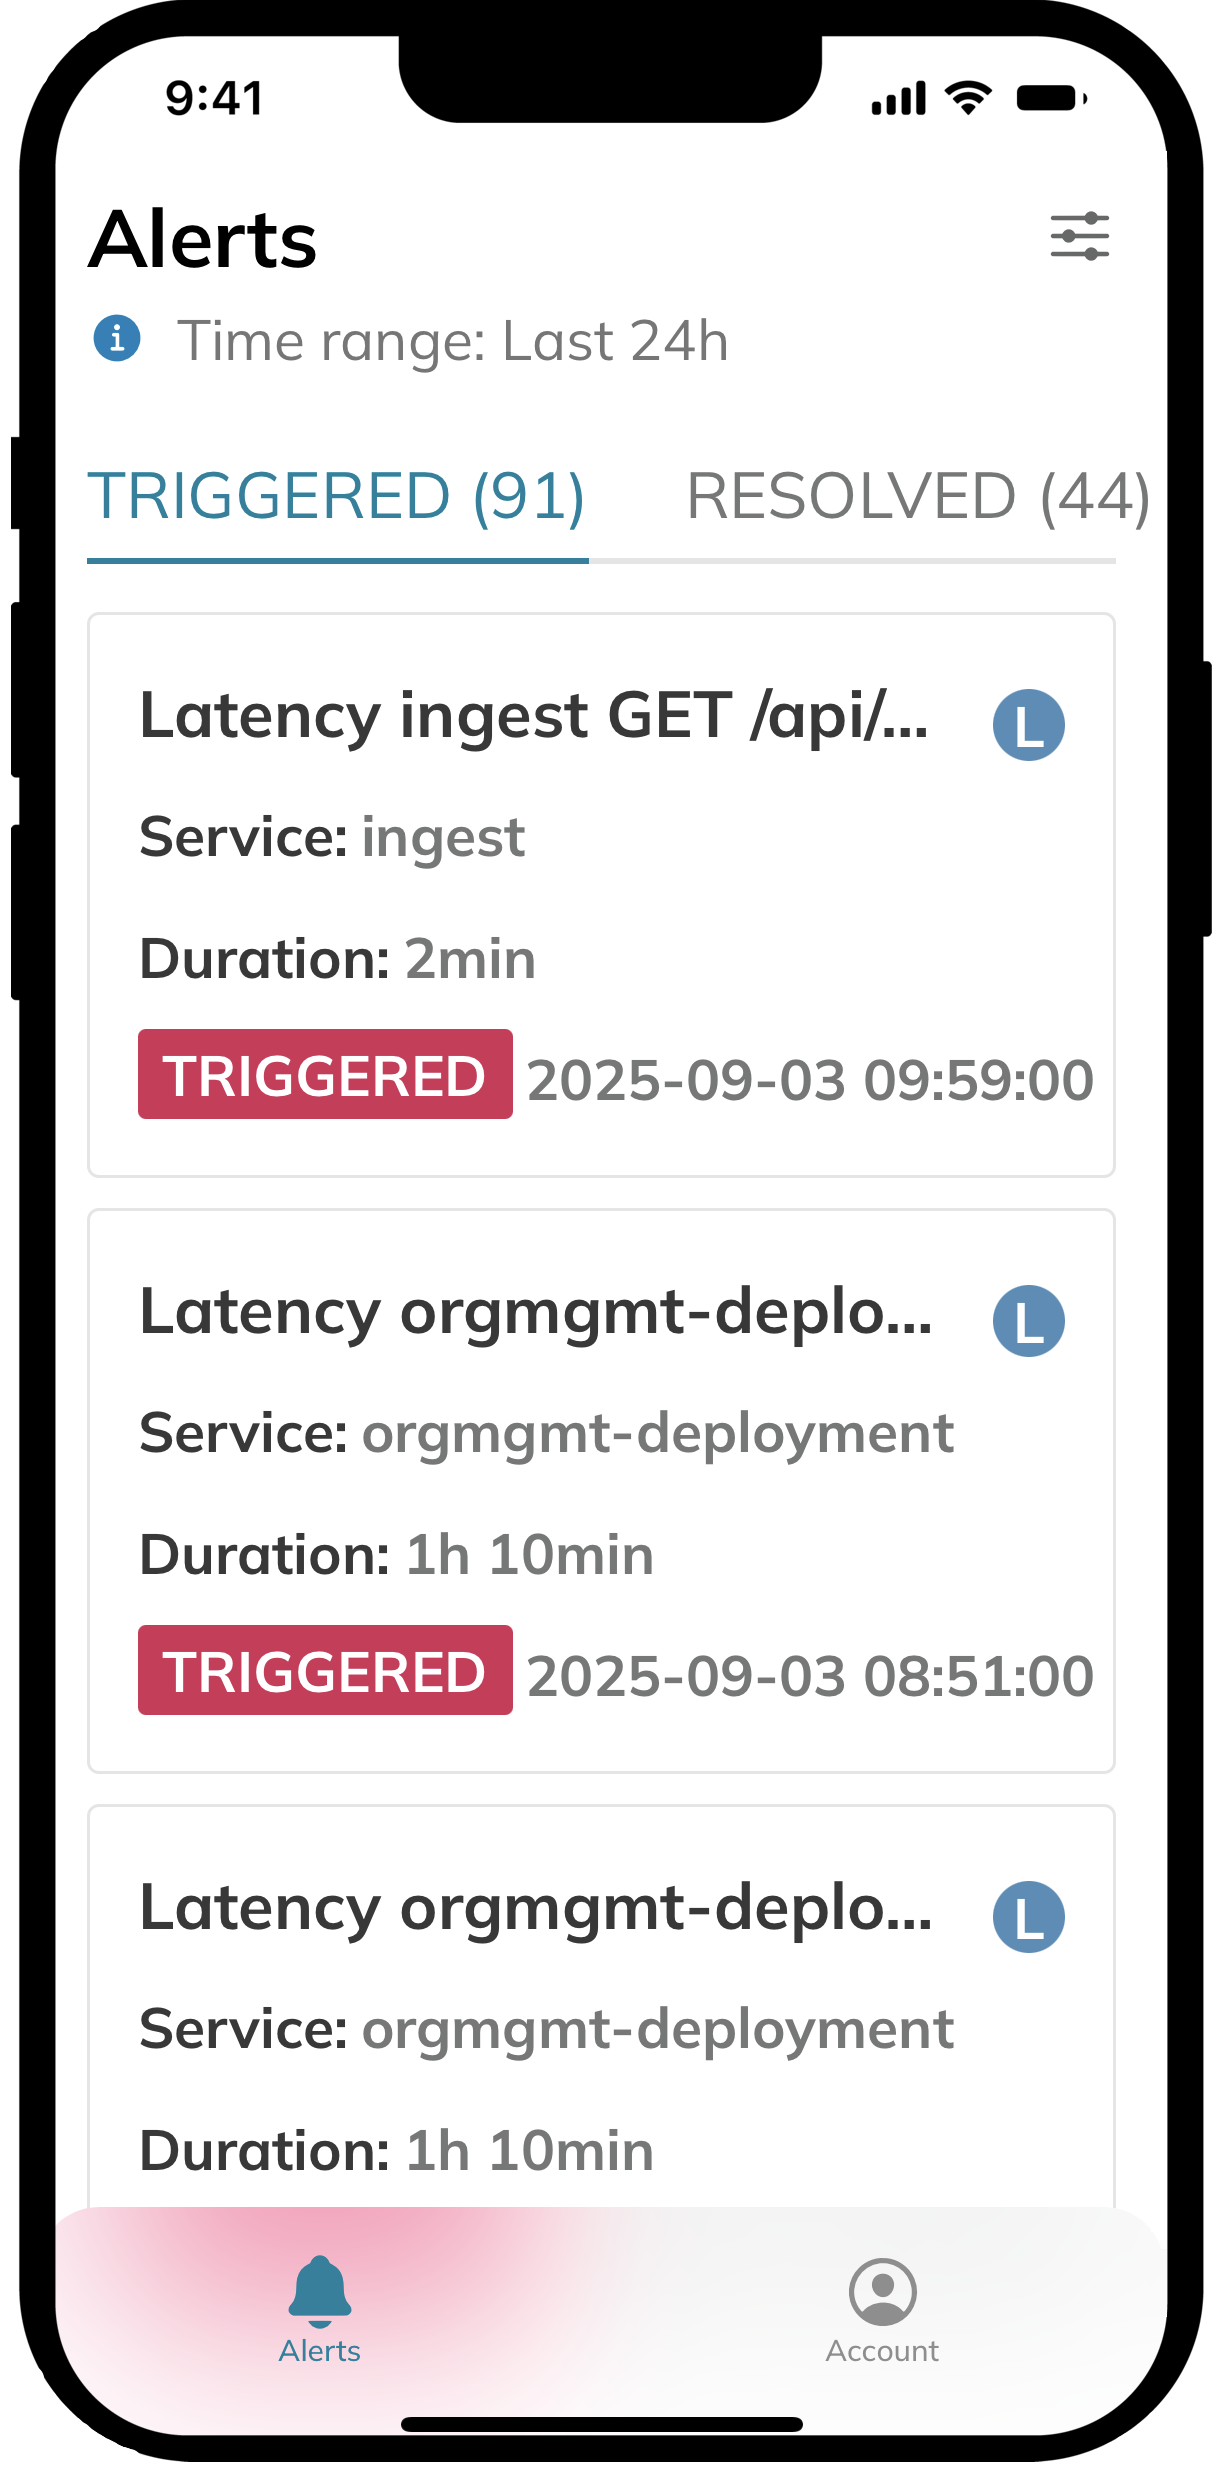
We are excited to introduce the Nobl9 Alerts mobile application, designed to help you respond to SLO alerts anytime, anywhere. It offers a native experience for SREs, DevOps engineers, and on-call personnel to manage the entire alert lifecycle—from triggering to resolution—directly from their mobile devices. With the Nobl9 Alerts app, you'll have critical service health information at your fingertips, enabling you to respond to incidents on the go.
The app allows you to:
- Stay on top of alerts—See all triggered and resolved alerts in one place. You can quickly filter by status, severity, and other criteria to find what needs your immediate attention.
- Get the full context—View associated SLOs, detailed descriptions, labels, and contextual charts to understand the impact and history of every alert.
- Reduce alert fatigue—Silence noisy alert policies during a major incident or planned maintenance. You can also view and resume previously silenced alerts.
- Collaborate with your team—Copy a link to an alert and share it with your team to resolve incidents faster.
The Nobl9 Alerts app is available for both iOS and Android.
With the Nobl9 Alerts app, you can manage the entire alert lifecycle on the go, from triggering to resolution, keeping critical service health information at your fingertips.
improved Data consolidation options for composite SLOs
Composite SLOs aggregate data from multiple components to form a single, unified value. Previously, component reliability was the only metric available for calculating the composite's reliability, using a weighted mean of each component's per-minute reliability.
This release introduces another aggregation metric: error budget state. Error budget state method considers whether each component has any error budget remaining. The composite's per-minute reliability is then calculated based on the weighted mean of components that have a positive error budget.
| Key point | Reliability | Error budget state |
|---|---|---|
| Choose for | Operational purposes to track trends over time. How well is the system running right now? | Contractual or compliance reporting to know if an SLO has been breached. Are we adhering to our agreements? |
| Why this choice | A nuanced reliability monitoring. Components rarely hit 0% or 100% reliability, and per-minute calculations capture subtle changes. | A strategic, big-picture view. Focuses on the binary outcome of whether an SLO is met or not, which is often preferred for executive-level reporting on total downtime. |
| Core logic | Declines proportionally to component health (e.g., 99% → 95% → 90%), allowing for early intervention. | A component's state is 1 until its budget is fully exhausted, at which point its state drops to 0. |
| Edge cases | Averages can hide isolated failures. A failing component might be masked by others that are performing well. | For equally-weighted components, the composite reliability is the proportion of healthy components. A single "weighty" component burning its budget causes a distinct drop in the composite's reliability. |
| Trade-offs | Can sometimes obscure the impact of a single, critical failure. Compensate with balanced weights and a reasonable target. | Highly sensitive to budget exhaustion and masks gradual decline. You won't see a component failing until its entire budget is gone. |
The aggregation metric selection is available in the composite SLO wizard in Step 2: Components, within the Data consolidation block. For users of the SLOs-as-code approach, the YAML configuration must contain the aggregation field with either the Reliability or ErrorBudgetState value:
apiVersion: n9/v1alpha
kind: SLO
metadata:
name: user-journey
displayName: User journey
project: customer-facing-applications
spec:
budgetingMethod: Occurrences
objectives:
  - displayName: Excellent
    name: excellent
    target: 0.96
    composite:
      maxDelay: 15m
      components:
        objectives:
          - project: servers-and-databases
            slo: CPU usage
            objective: excellent
            weight: 3
            whenDelayed: CountAsBad
      aggregation: ErrorBudgetState
# The rest of your composite SLO configuration
The default aggregation metric is Reliability.
Choose the aggregation method that best suits your reporting needs, whether for operational insights or high-level compliance tracking.
improved Replay performance improvements
This release improves Replay performance and the time it takes to retrieve and calculate historical data. The improvement is especially noticeable when replaying SLOs for longer time periods.
Documentation updates
Documentation for the new aggregation metric is on the way. Check back soon for the full guide.