Nobl9 application (1.75.0)
- Time offset on the Service health dashboard by burn rate
- Add metadata annotations to alert policies, projects, SLOs and services
- Service health dashboard by error budget visuals
- Service health dashboard performance

Release details
new Time Offset on the Service health dashboard by burn rate
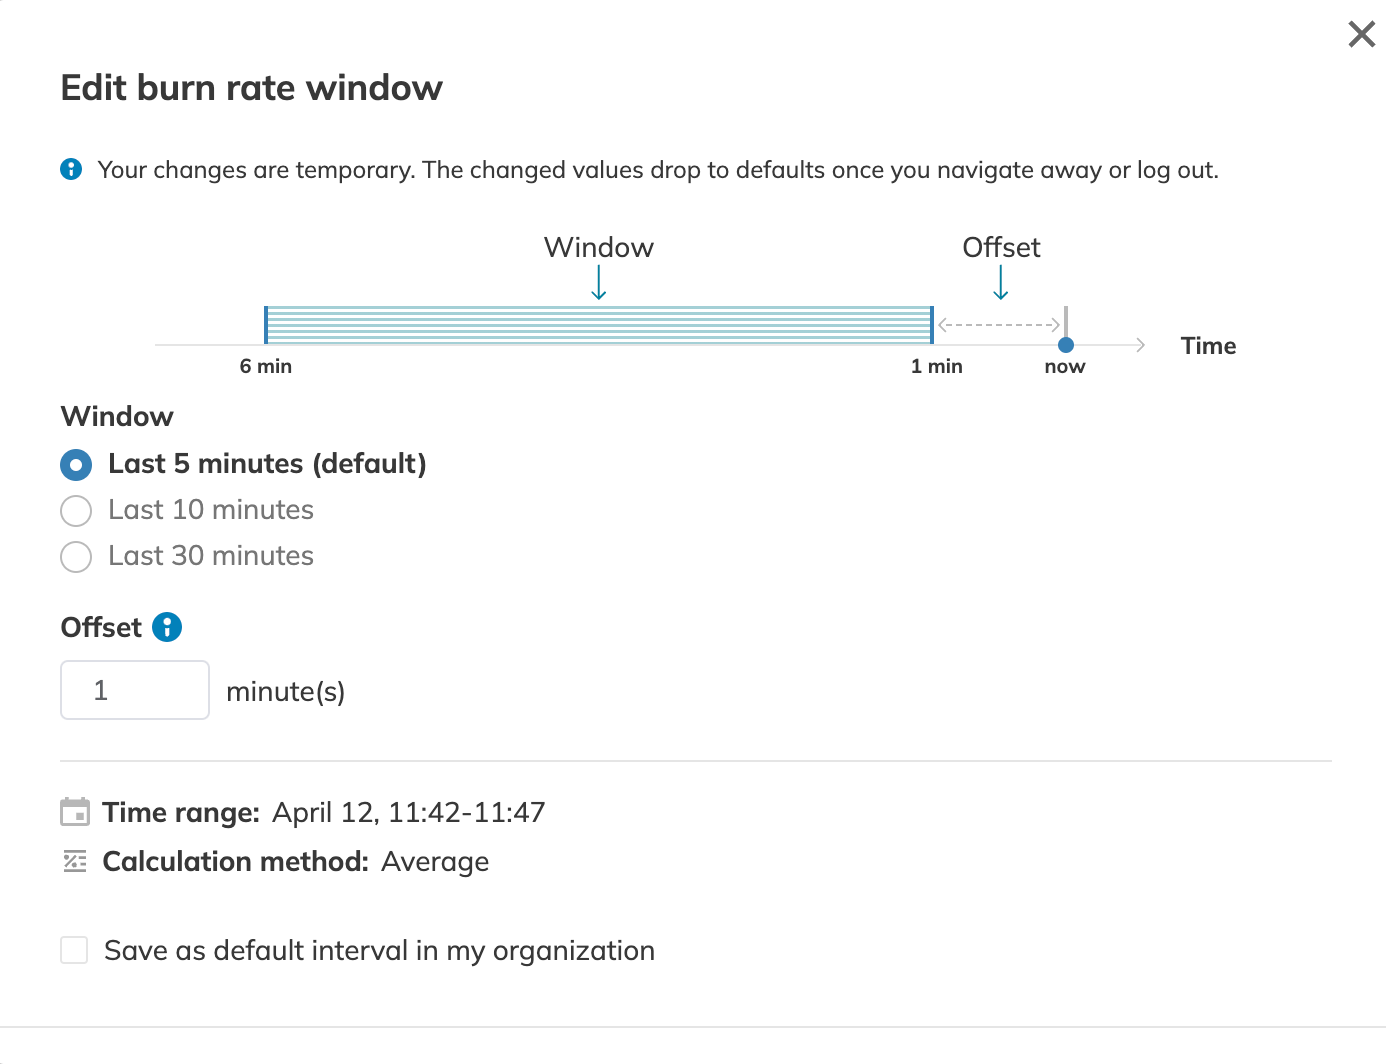
You now have the option to set a time offset for your Service health dashboard by burn rate. This feature lets you specify how far back in time Nobl9 should collect burn rate data for dashboard calculations. It comes in handy when your SLOs require more time to retrieve metrics from your data source (if you have configured the query delay parameter to > 0) and you are seeing your services report as "no-data".

The offset, along with the calculation window length, provides you with complete control over the freshness and duration of the burn rate data displayed on your dashboard. You can customize both of these parameters to suit your preferences or save them as a default setting for your organization.
new Metadata annotations
We've added a new feature that allows you to add metadata annotations on SLOs, services, projects, and alert policies. Metadata annotations are non-identifiable key-value pairs that you can use to provide additional information about your Nobl9 objects. For instance, you can use them to define the implementation details and system-specific metadata about the SLO. Along with labels, metadata annotations provide another way of adding descriptive information to your objects. For more details on the comparison between labels and metadata annotations, see labels vs metadata annotations.
Note that metadata annotations are not visible on Nobl9 Web, and you can only add them using sloctl or Nobl9 SDK for Go.
Here's an example of how to add metadata annotations to an alert policy via YAML:
apiVersion: n9/v1alpha
 kind: AlertPolicy
 metadata:
   name: trigger-alert-immediately
   project: death-star
   annotations:
     registry: docker.io
     visibility: internal
 spec:
   description: Dummy AlertPolicy
   conditions:
     - lastsFor: 0m
       measurement: burnedBudget
       op: gte
       value: 0.99
   coolDown: 5m
   severity: Medium
   alertMethods: []
improved Service health dashboard by error budget
We've updated the look of the Service health dashboard by error budget to match the new visuals introduced with the new Service health dashboard by burn rate. This update included improvements to tooltips, label size, service circle lines width, and general spacing adjustments.
improved Service health dashboard performance
We've also improved the performance of Service health dashboard by error budget and Service health dashboard by burn rate. These improvements will make working with a large set of data (1000+ SLOs) faster and more efficient.