Nobl9 application (1.81.1)
- Alert details: Enriched visualization on alert charts
- Alert details: ServiceNow Observability Error Ratio SLI view as Events/Sec
- SLO details 2.0: Streamlined access to the selected SLO objective
- SLO details 2.0: Clicking an SLO name unfolds its metadata

Release details
improved Alert details: Enriched visualization on alert charts
The yellow Condition threshold crossed interval on your alert chart shows the precise moment the alert threshold was crossed before the alert itself was triggered. You can see this for both the alerting window and lasts for types.

The green Cooldown interval indicates the alert's cooldown timer. This timer starts after the conditions triggering the alert are no longer met. The alert resolves if none of those conditions are met again during the cooldown period.

And more of it:
- Uncover resolution details: Hover over a resolved alert icon to learn the reasons for its resolution
- Deeper insights: Even more information about your alert trigger and resolution reasons
- Emulated transitions: A more visually appealing and intuitive experience with animated alert chart icons
- Consistency reigns: Consistency is key, and now your alert charts benefit from a unified visual style
improved ServiceNow Observability error ratio SLI view as Events/Sec
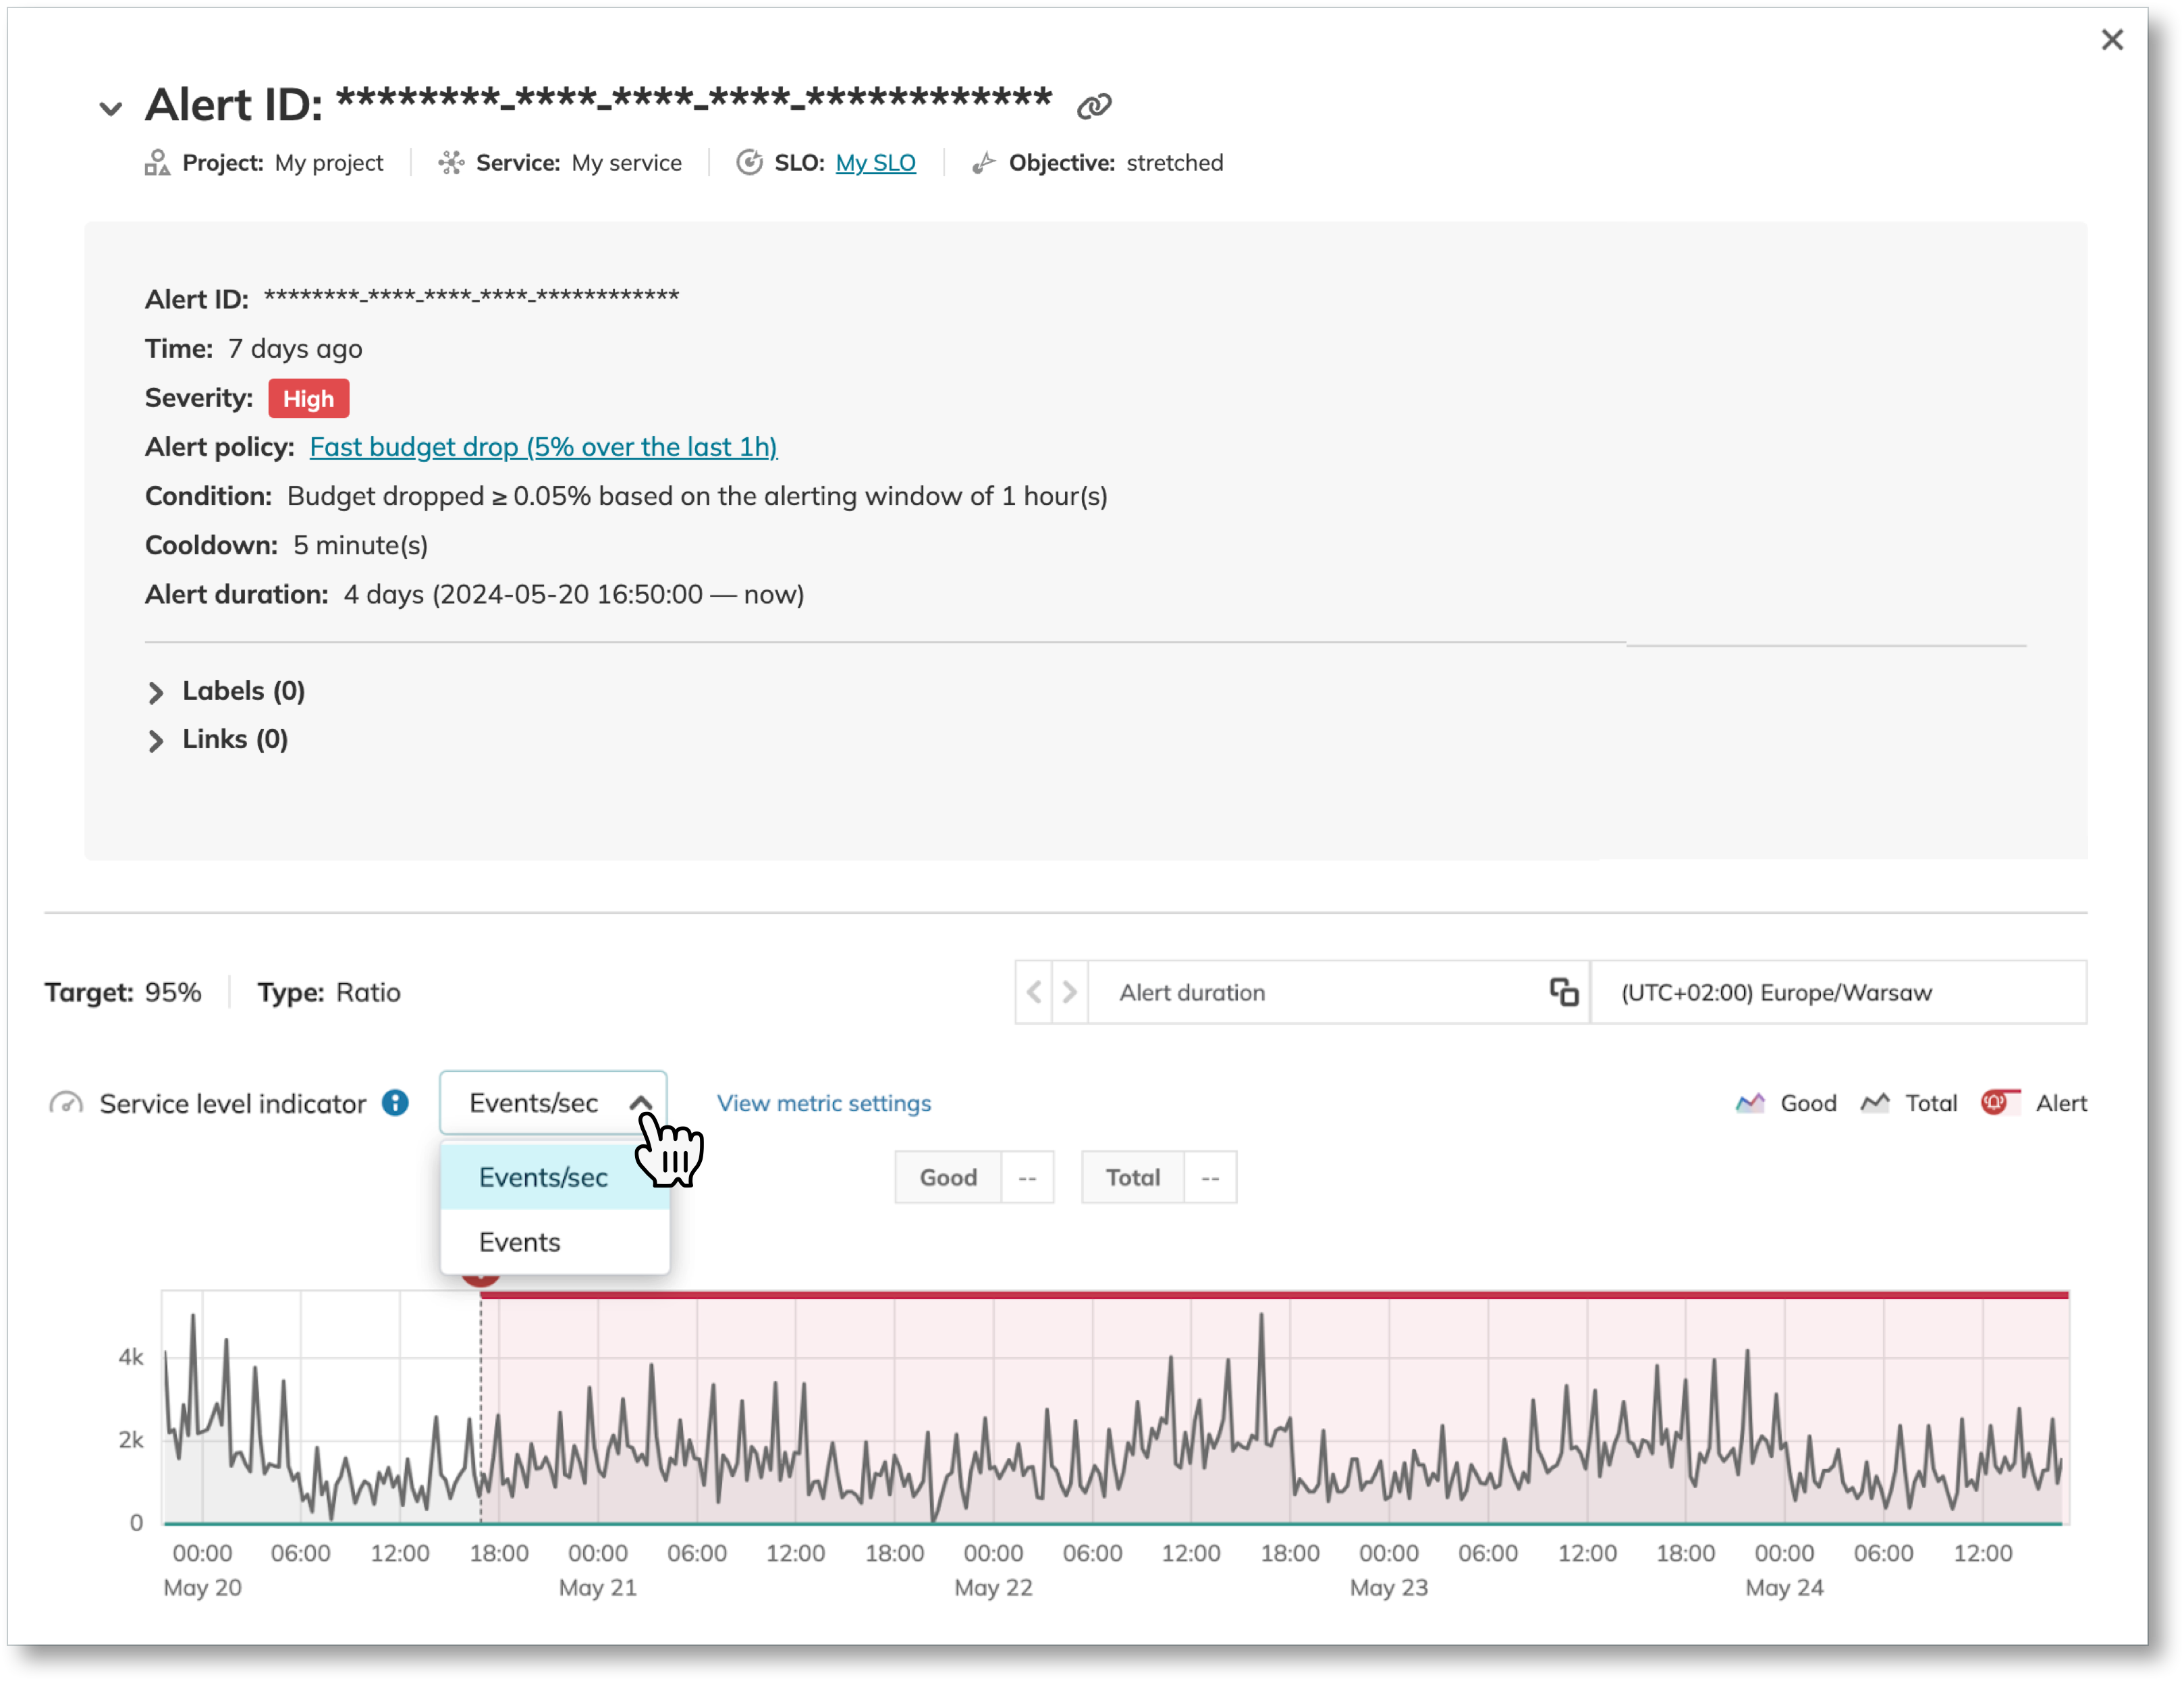
You can now view the SLO data as Events/Sec on the alert details of your ServiceNow Observability error ratio SLOs.

improved SLO details 2.0: Streamlined access to the required SLO objective
The redesigned SLO details make accessing objective details a breeze. Steer to the Objectives list under the Overview tab. With a single click on the desired objective, you’re whisked directly to its charts.
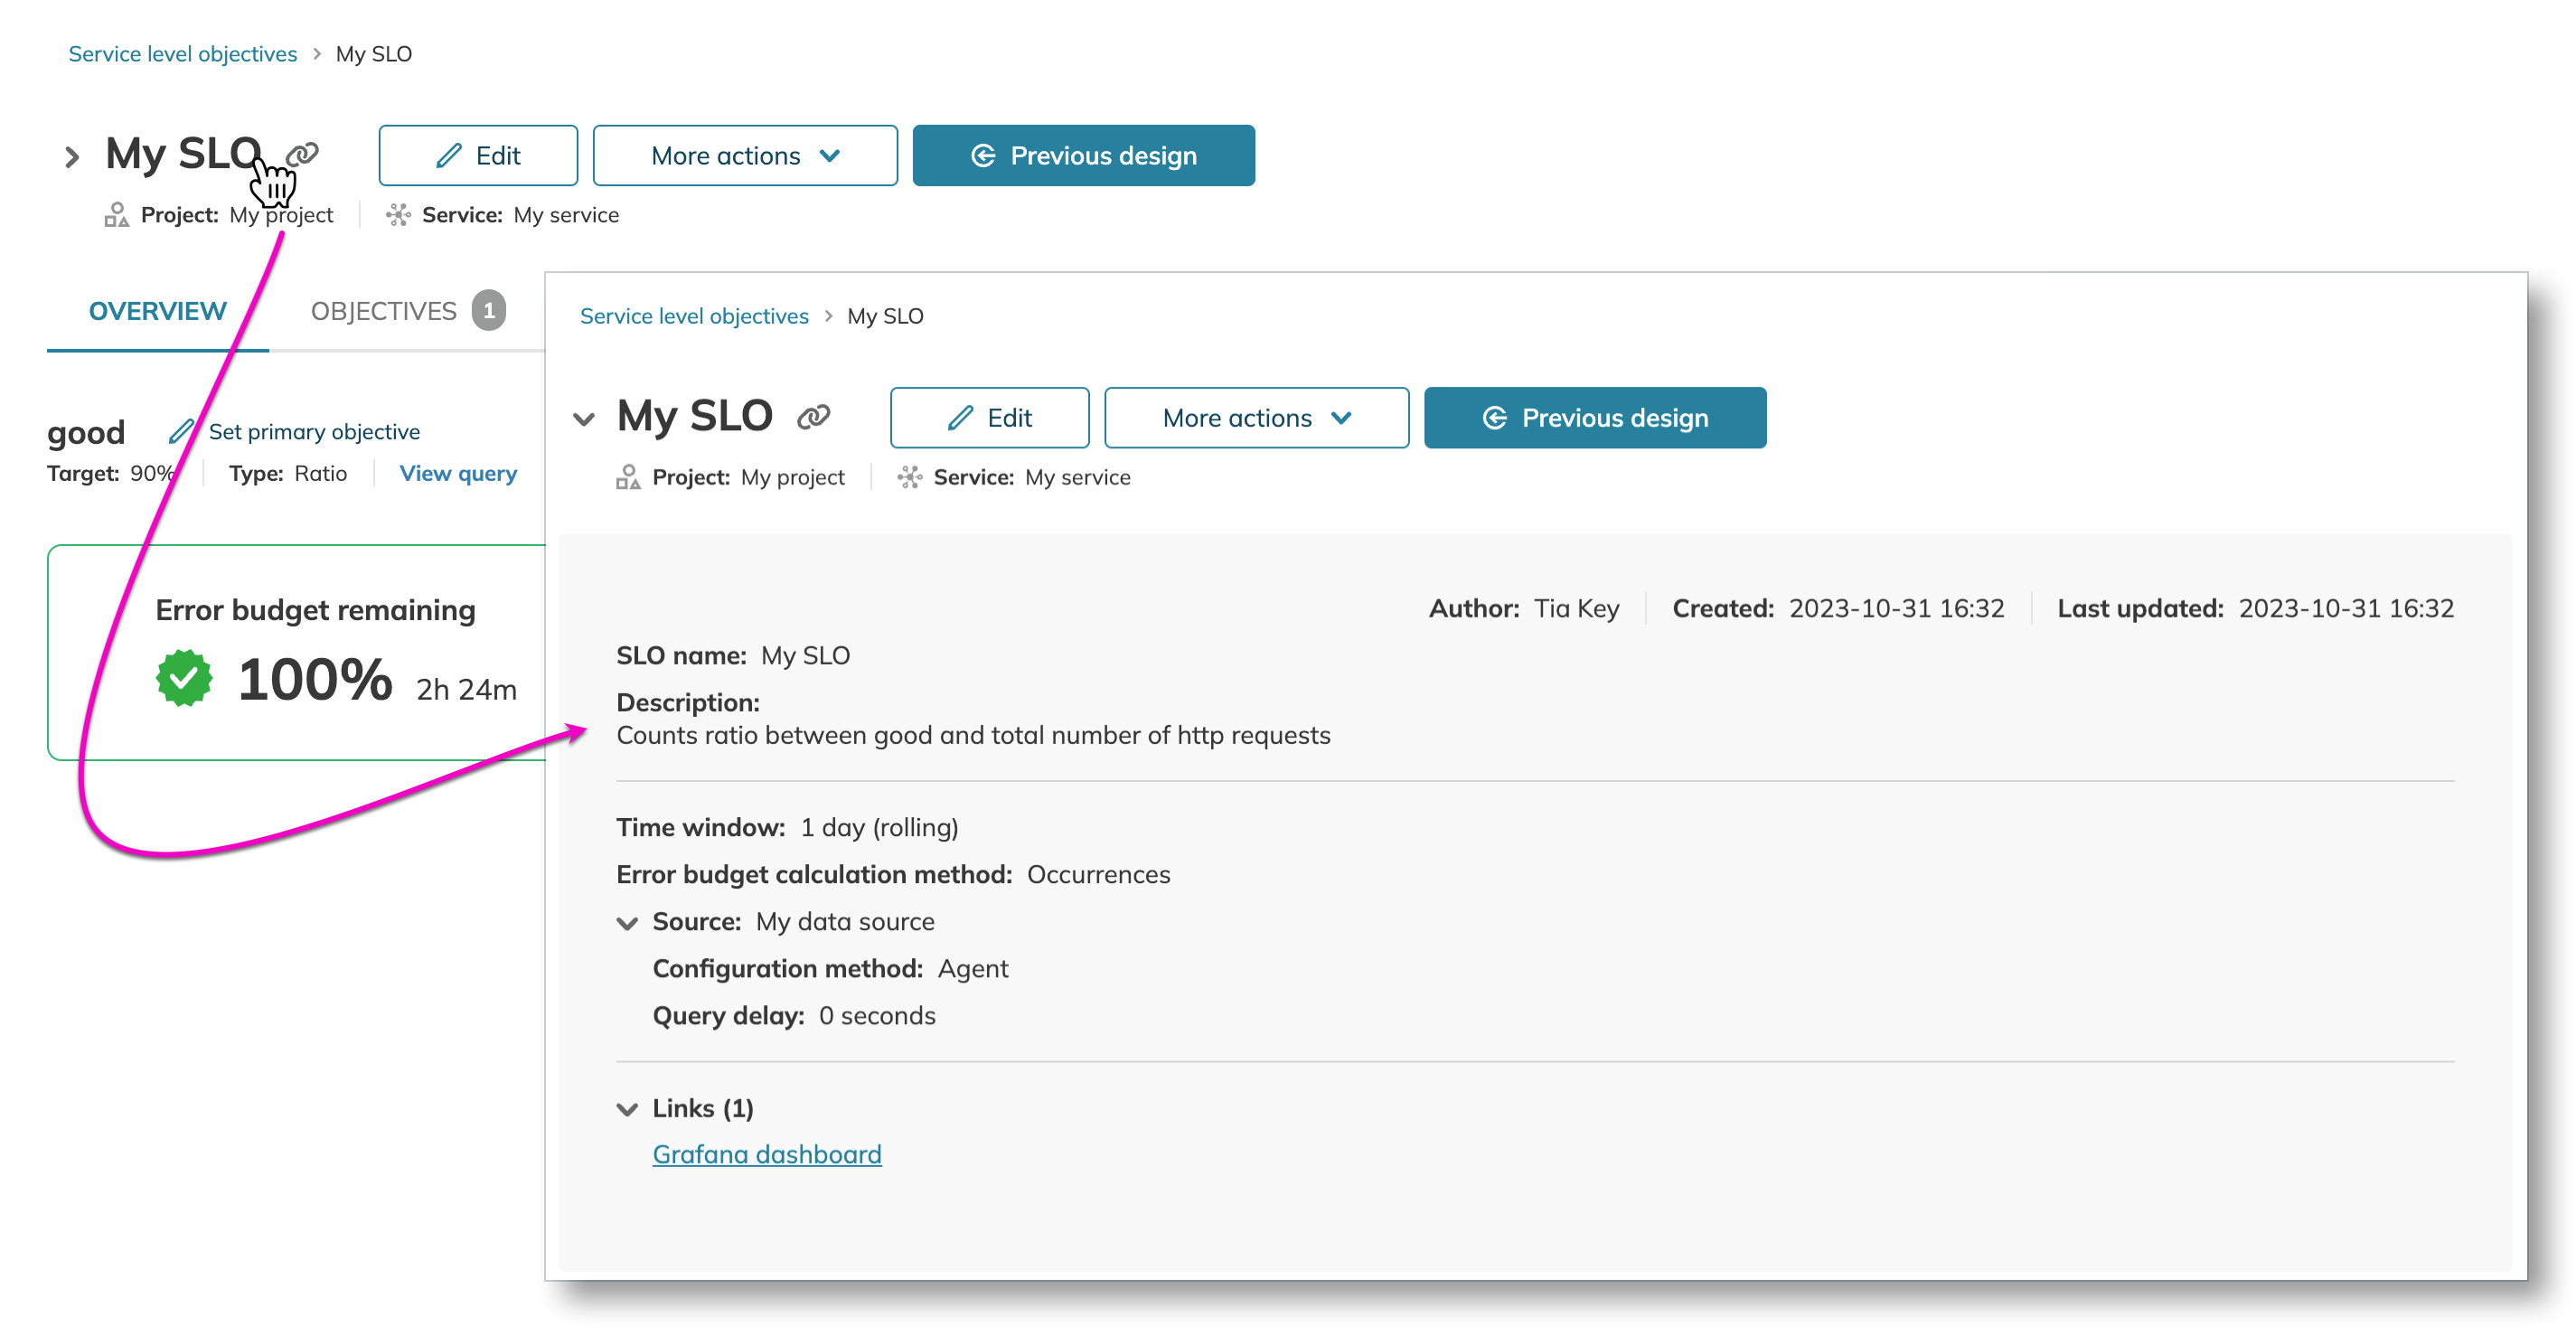
improved SLO details 2.0: Clicking an SLO name unfolds its metadata
No more struggling with pinpoint accuracy! You can now click anywhere on your SLO or objective name to open its metadata block.
