Nobl9 application (1.156.0)
- Saved the last-visited view for the Service level objectives section
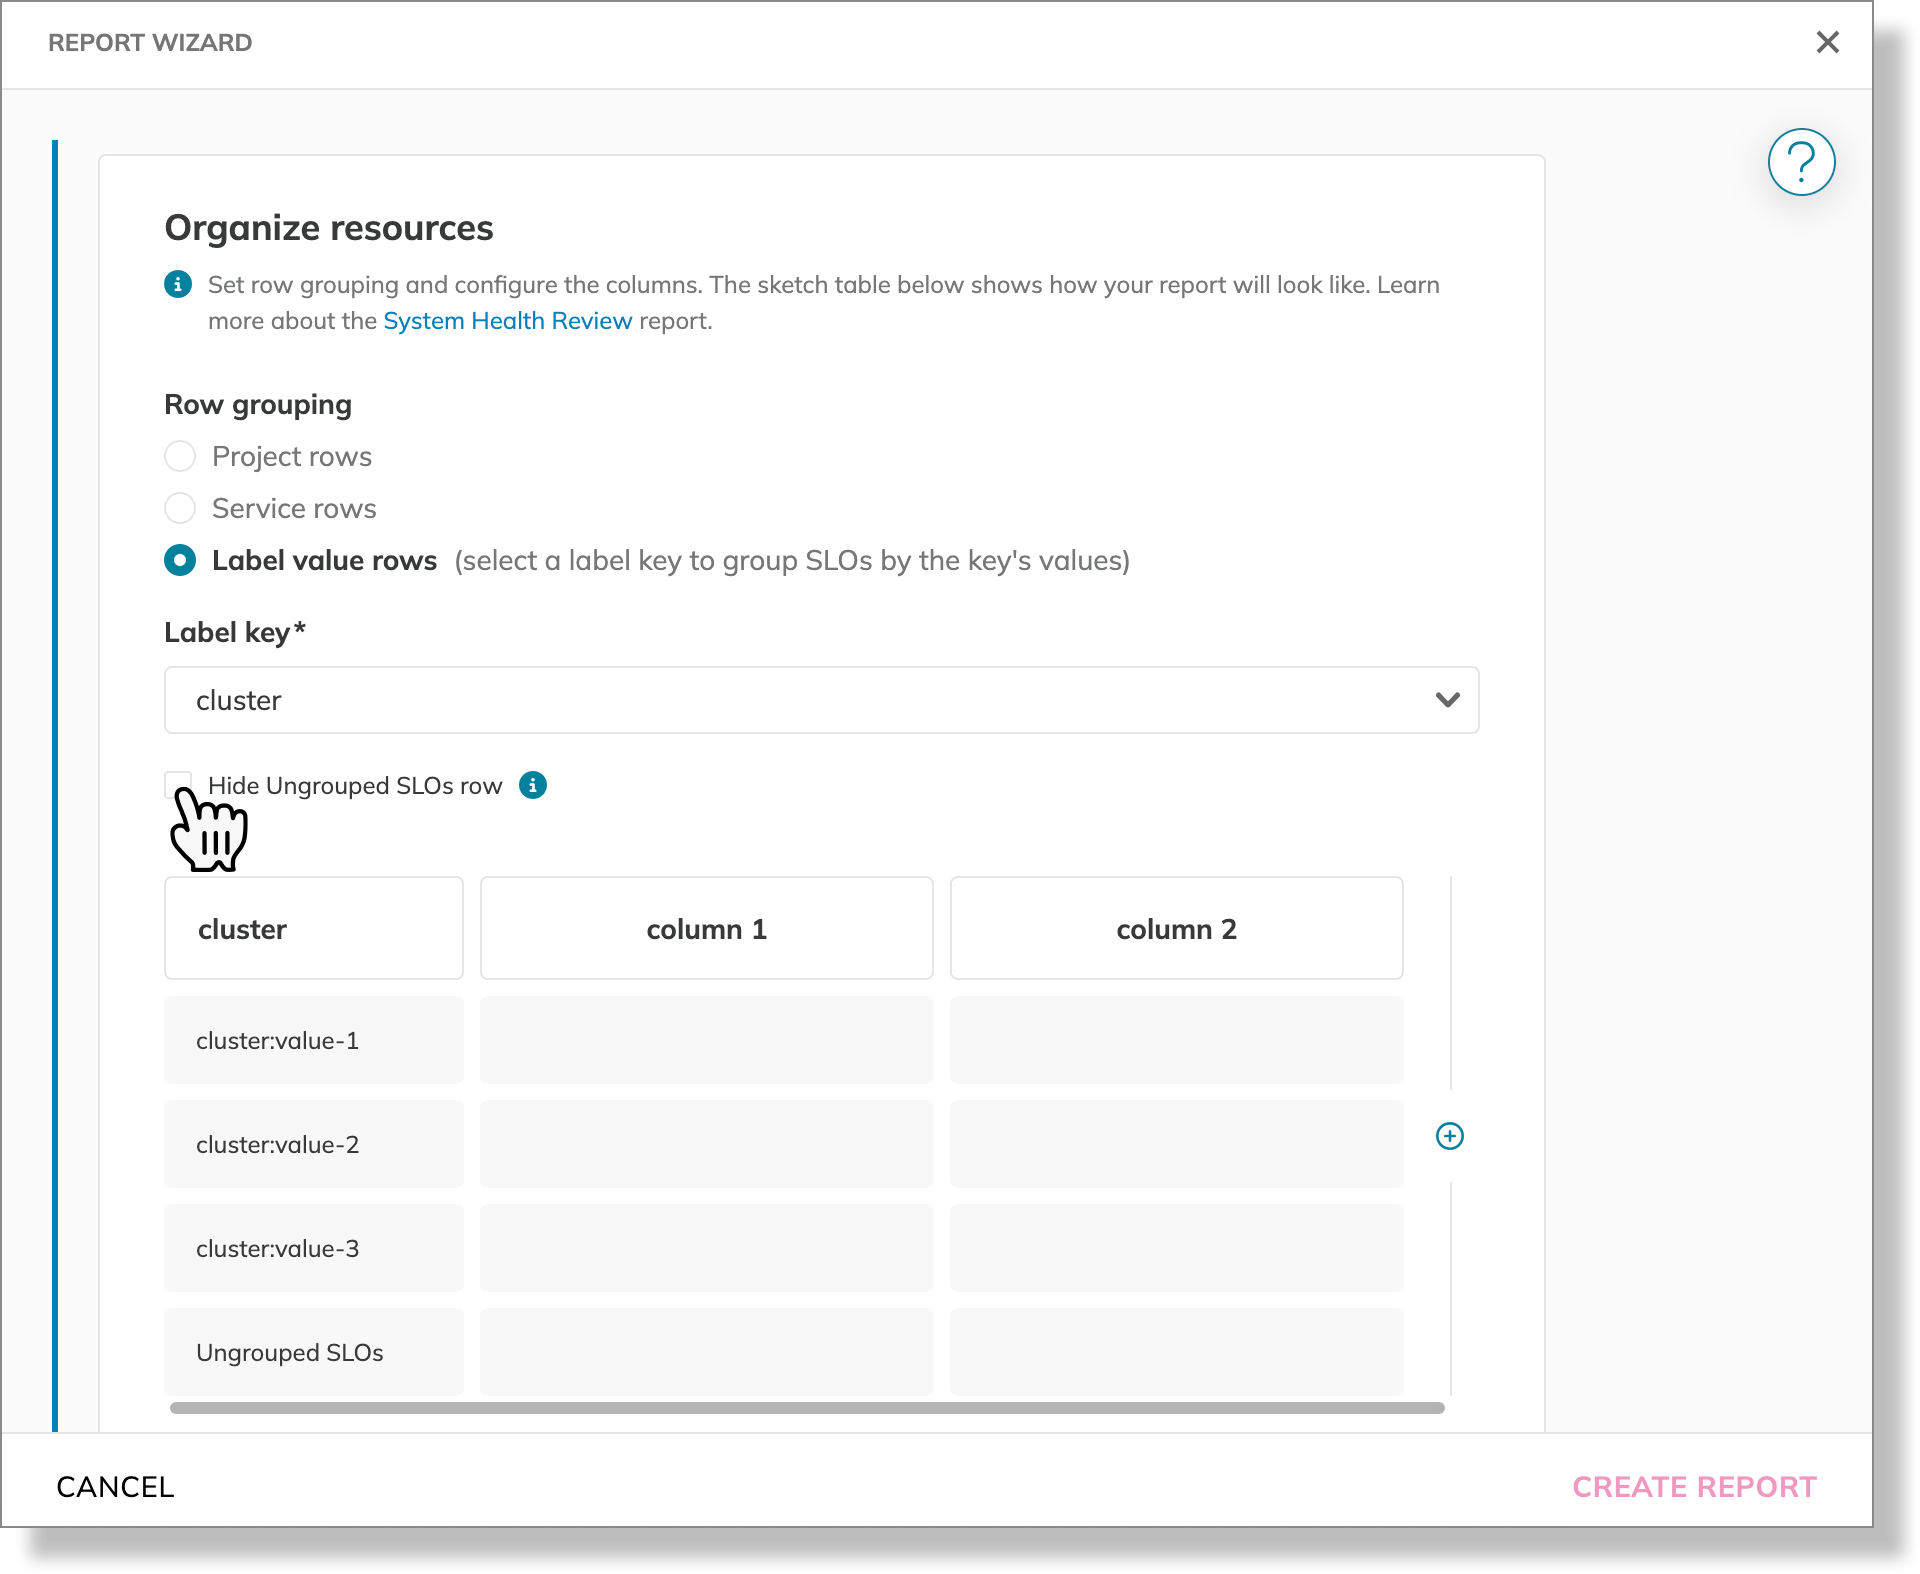
- Hide the Ungrouped SLOs category in the System Health Review report
Release details
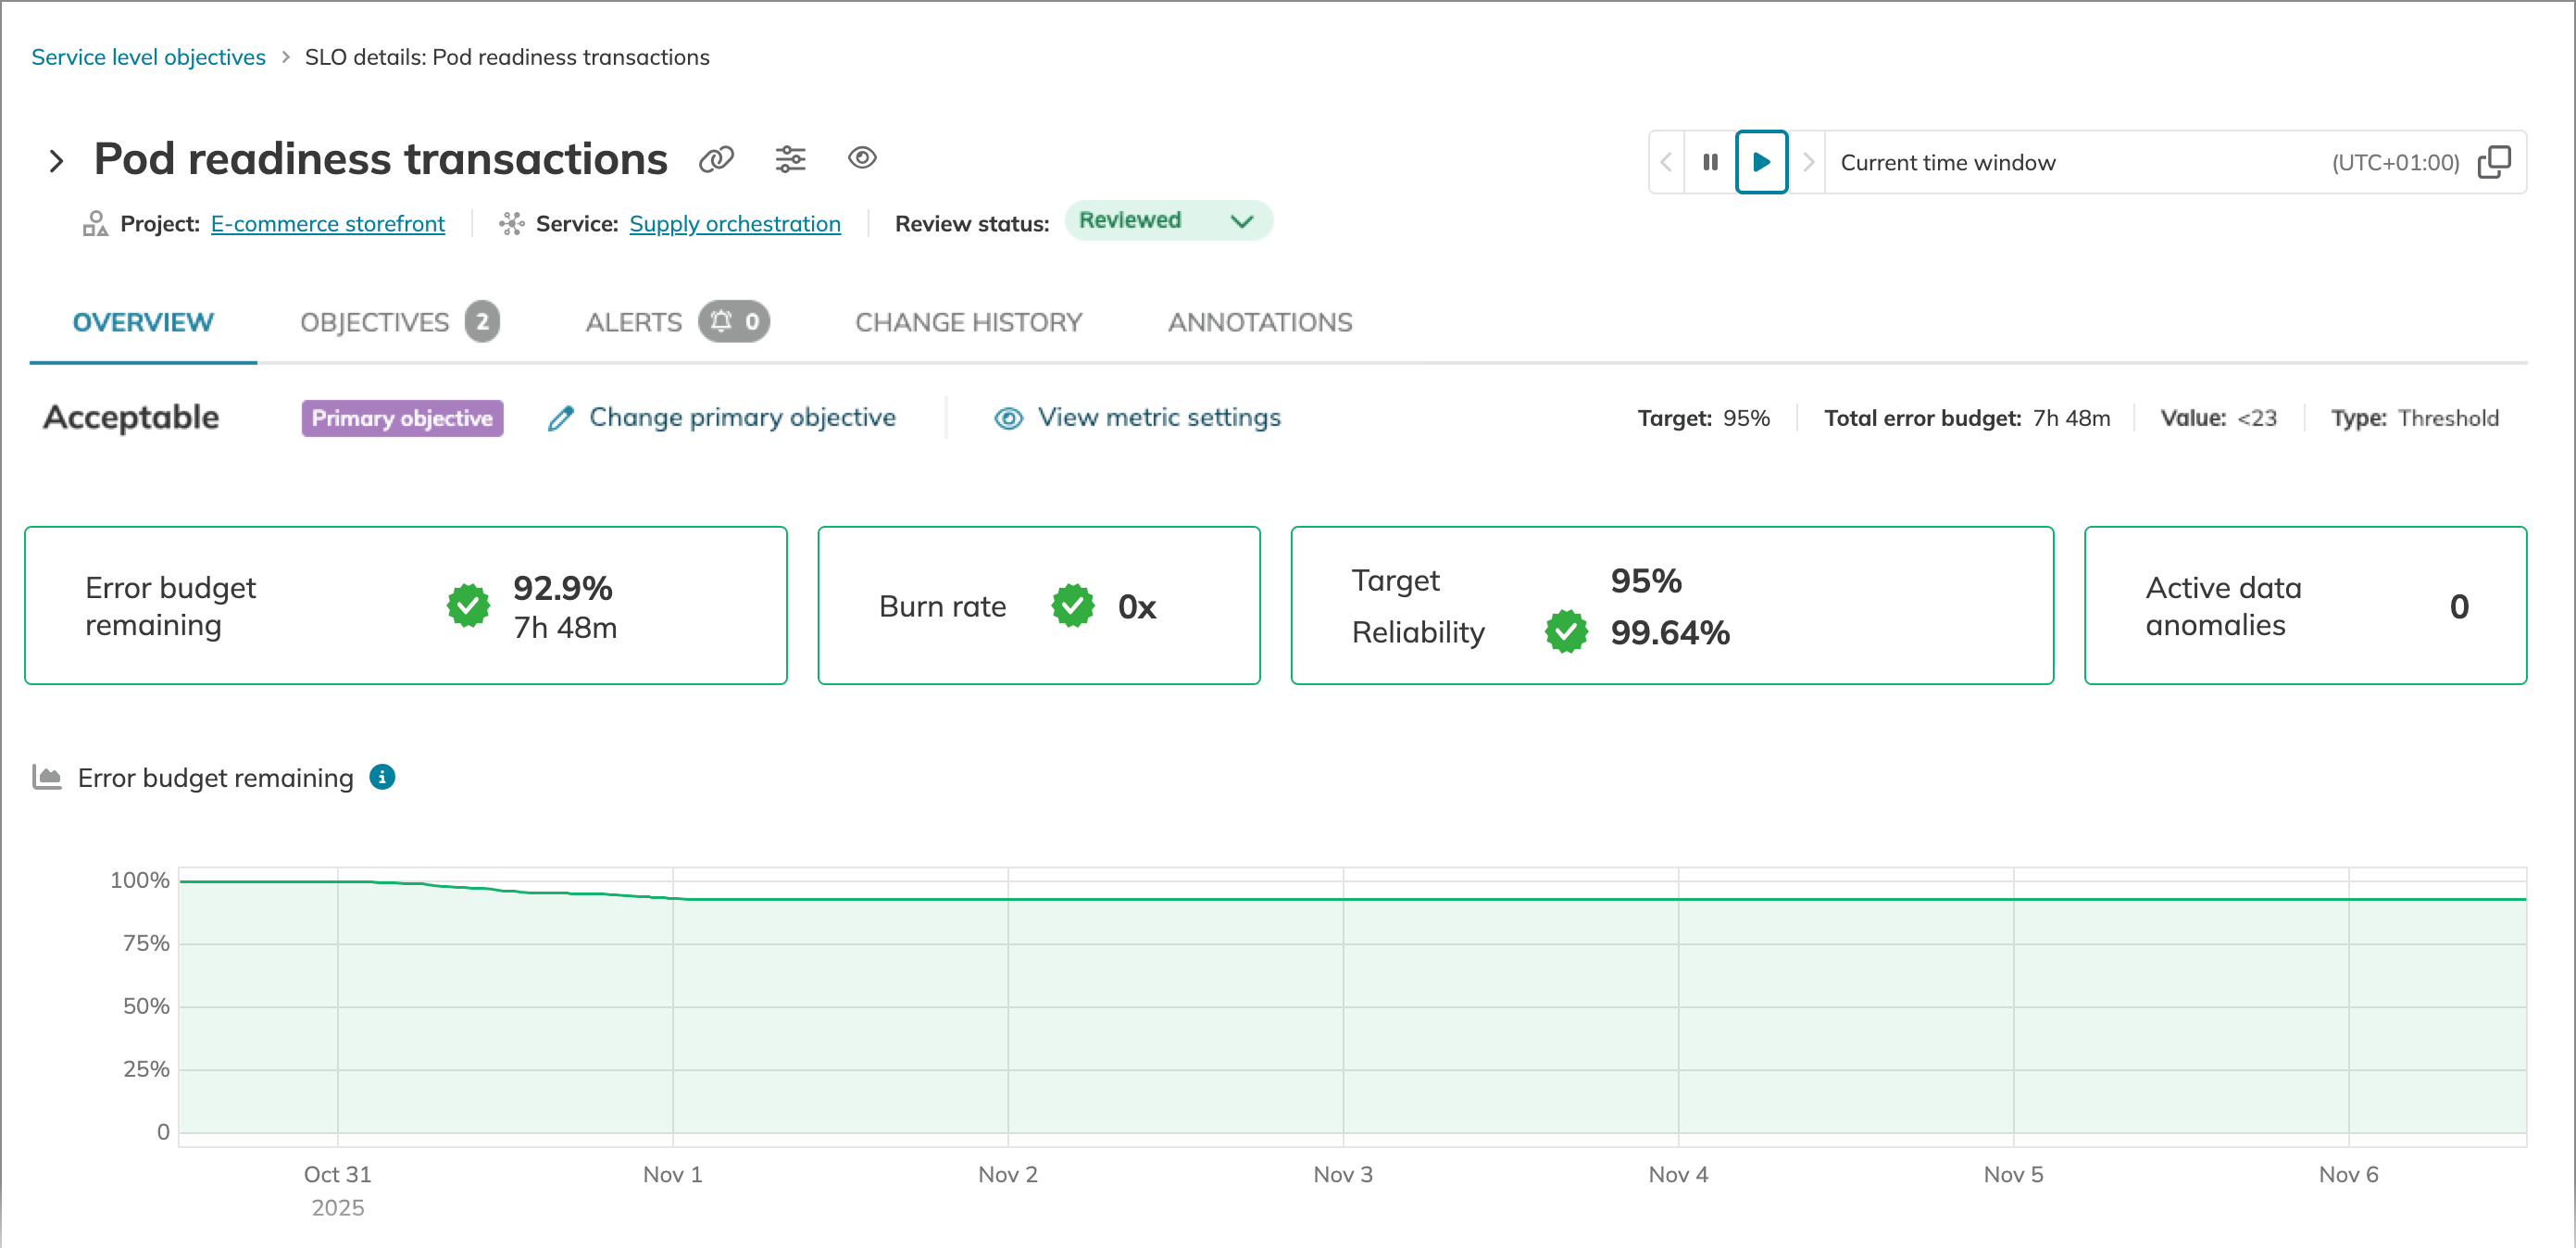
new Active data anomalies tile on SLO details
For immediate visibility into data quality issues, the SLO details page now features a new Active data anomalies tile.
This tile is located next to the Active alerts tile and displays a real-time count of all unresolved data anomalies affecting your SLO. It helps you instantly spot potential problems with your data source or query configuration that could impact the accuracy of your SLO calculations.
The count includes both manually configured and automatically detected anomalies and updates in real-time as they are detected or resolved. This enhancement ensures you have a complete, at-a-glance overview of your SLO's data integrity.
The data anomaly tile displays a count of detected issues. The types of anomalies included in this count depend on your Nobl9 Edition:
- In all Nobl9 Editions, the tile counts "No data" anomalies that are detected through manual configuration.
- For Nobl9 Enterprise Edition, the count also includes all automatically detected data anomalies.
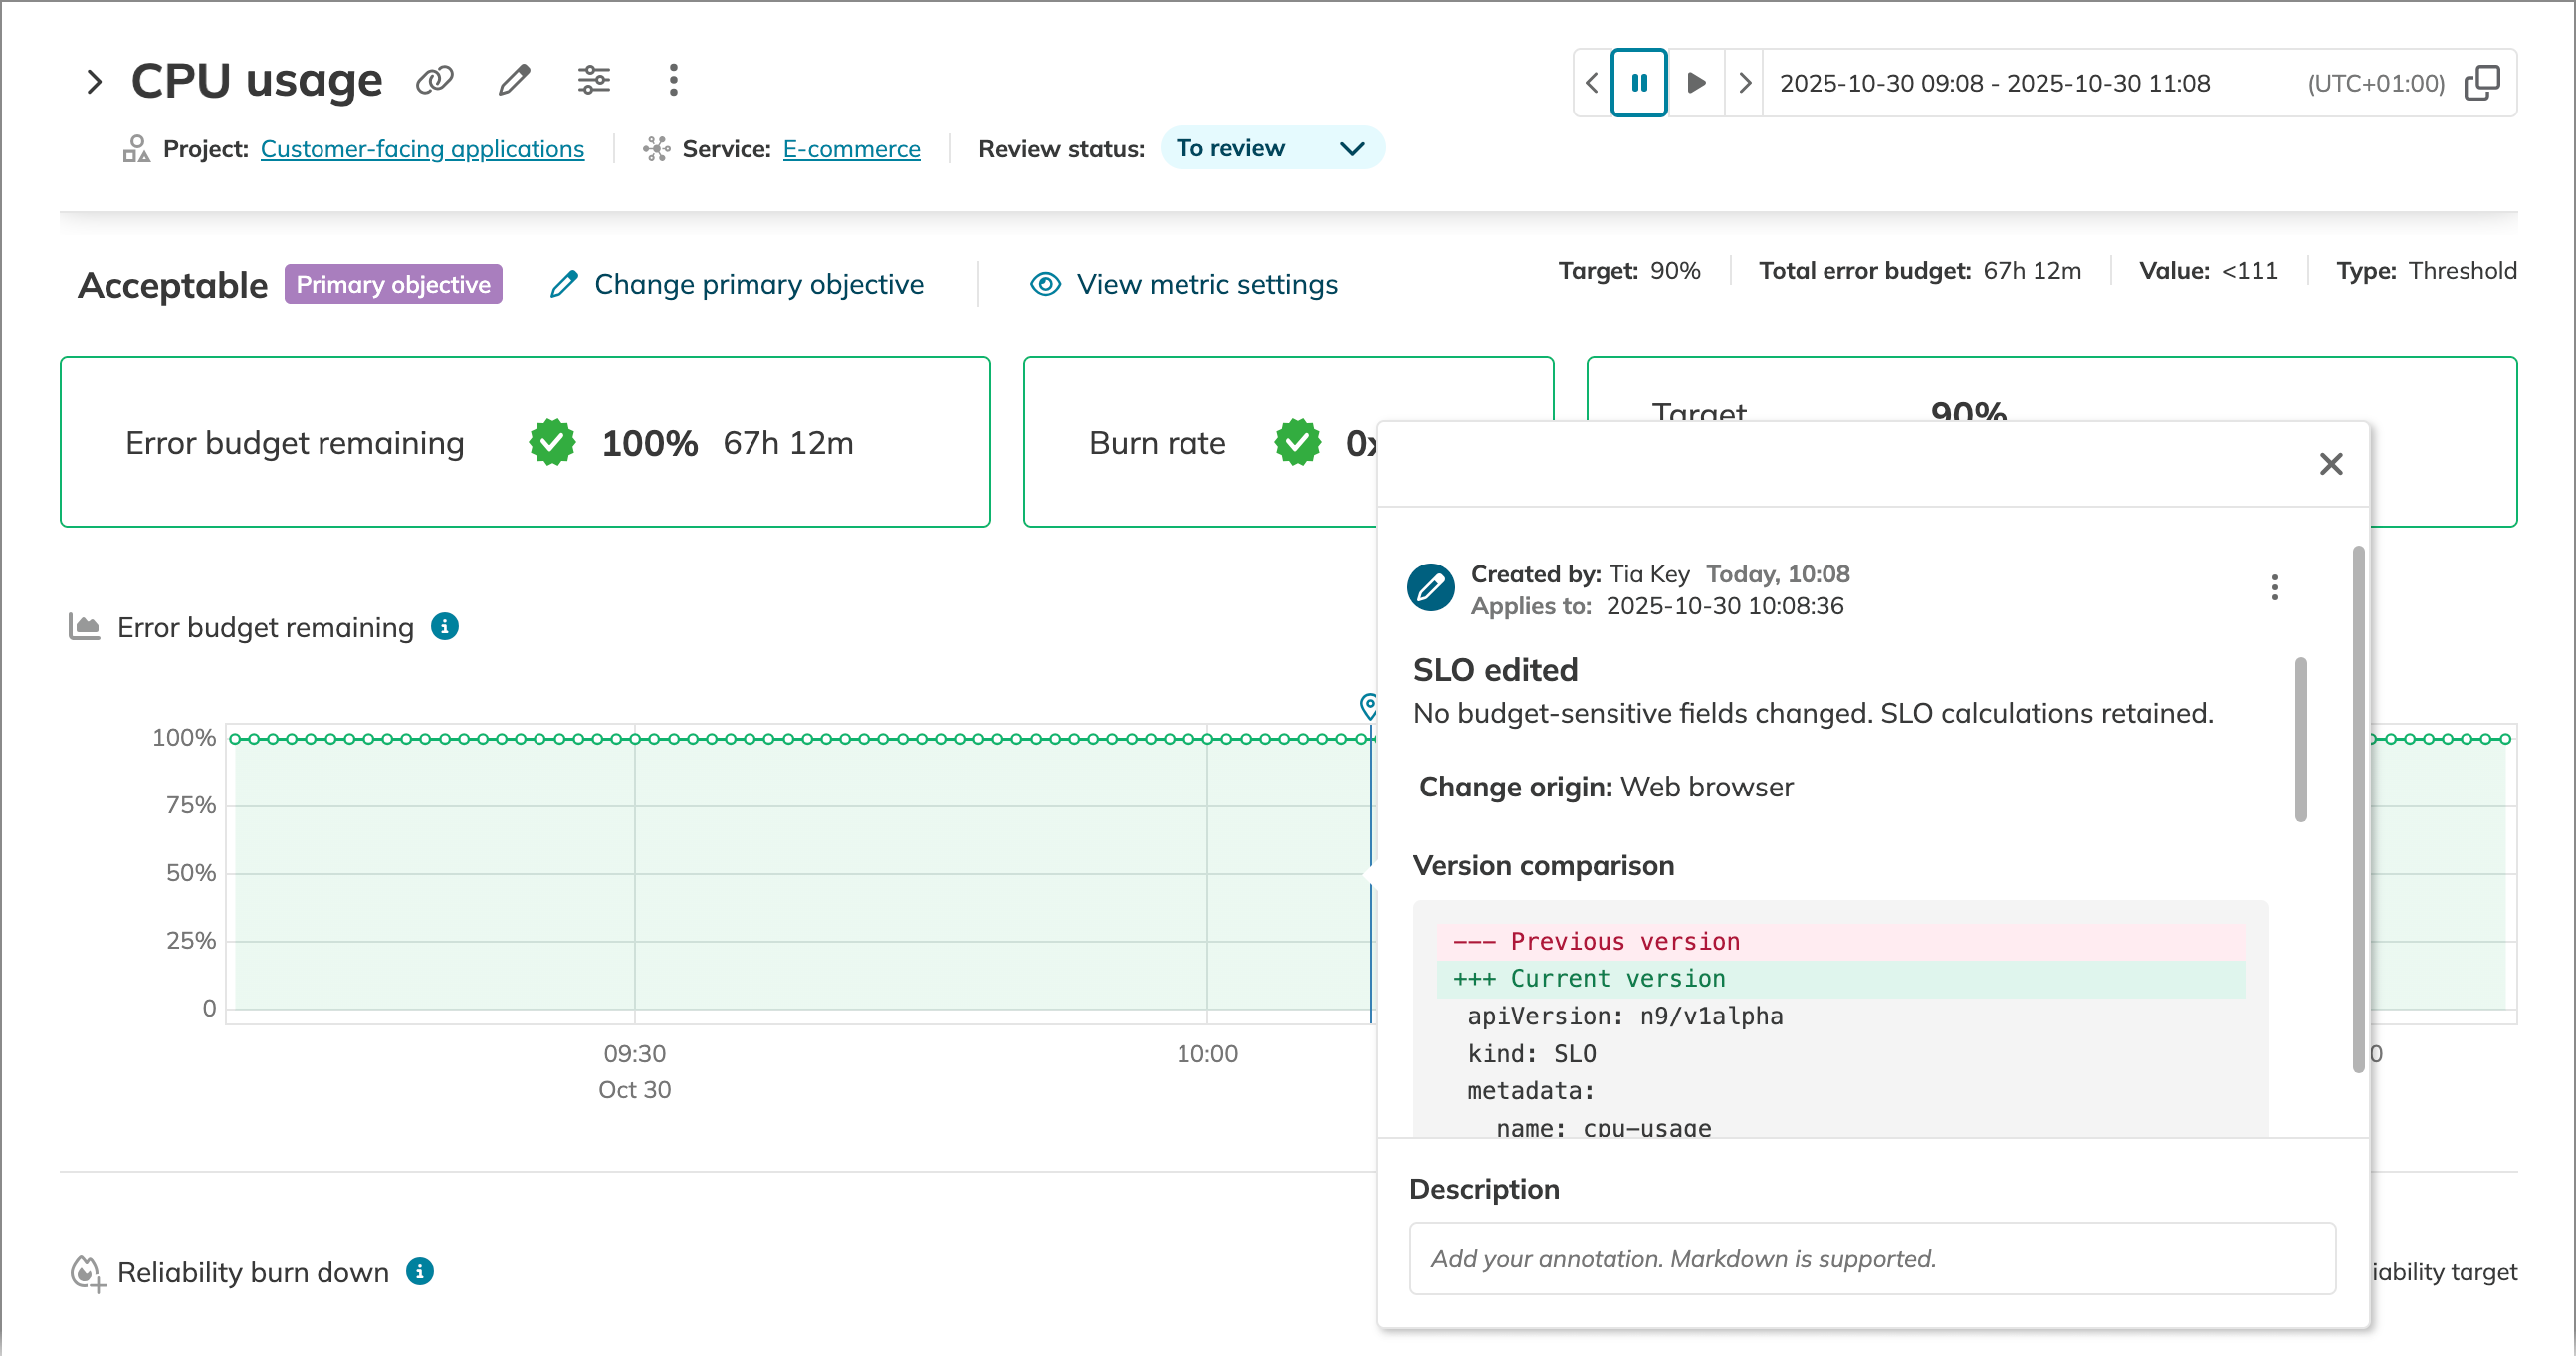
new Automatic annotations on SLO edits
To improve traceability and provide a clear audit trail, Nobl9 now automatically generates an annotation every time an SLO is edited. These annotations help you track an SLO's history and diagnose how changes impact its performance. Whenever an SLO is edited, an annotation is added to its chart, detailing:
- What changed—A YAML diff view clearly shows the differences between the previous and current configurations.
- Who and when—The user who made the change and the exact time of the edit.
- Change origin—The source of the modification (Nobl9 UI,
sloctl, Terraform provider, or an SDK). - Budget impact—An indication of whether the change impacted the SLO's error budget.
You can filter for these annotations in the Events section using the User > SLO edits filter. Additionally, the user who made the change can edit the annotation to add more context.
This feature is now active for all SLOs.
improved Saved last-visited view for the Service level objectives section
To create a smoother and more personalized experience, the Service level objectives page now automatically remembers your last-used layout.
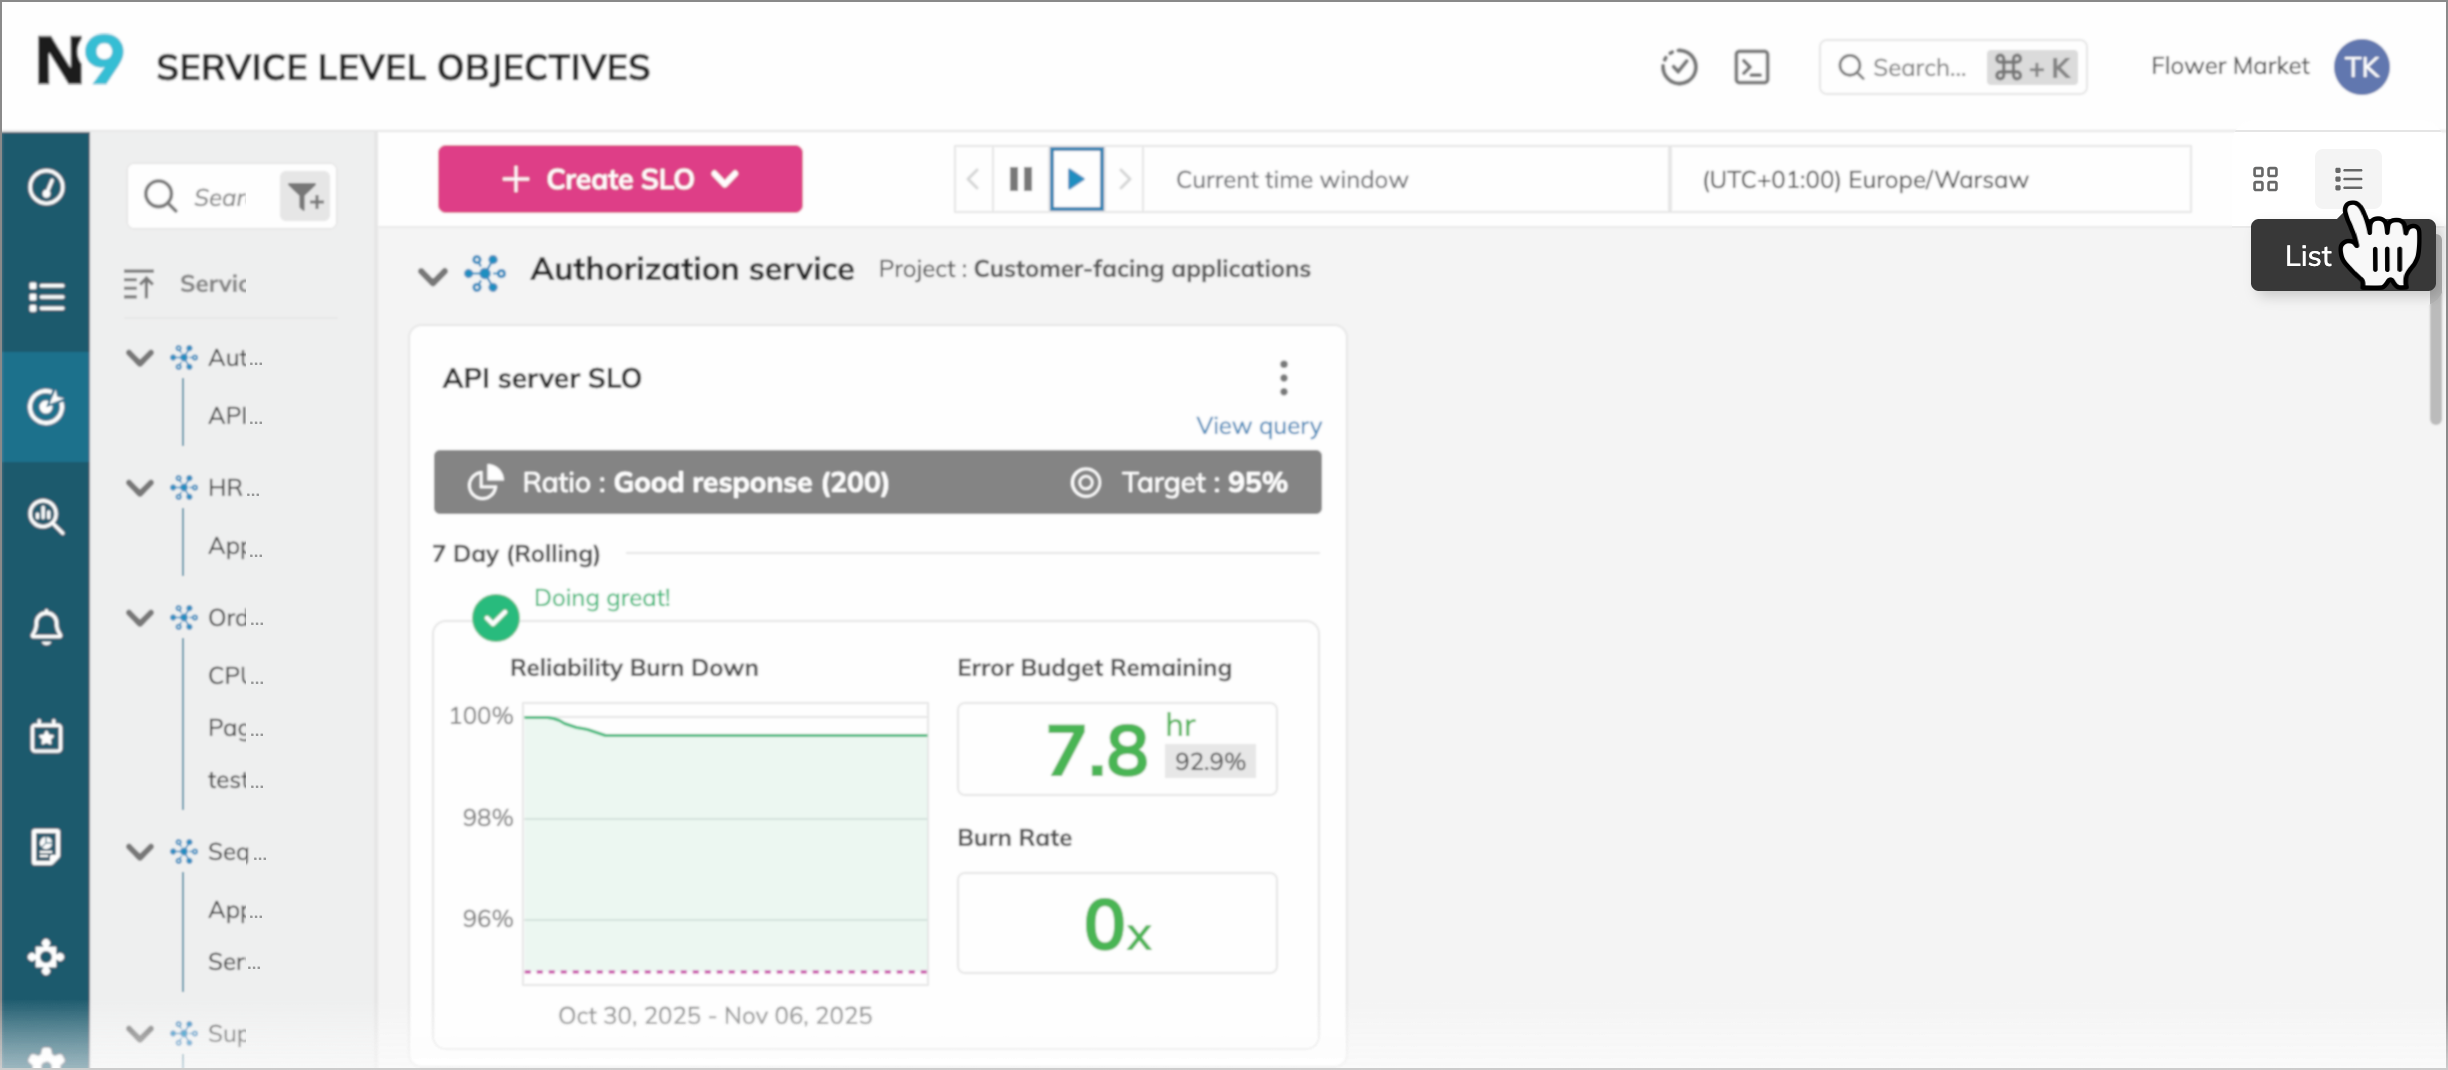
The page offers two distinct views: a high-level SLO grid and a detailed SLO list. Previously, the page would always default to the grid view. With this update, your selection is saved, so if you prefer the list view, Nobl9 will open directly to it on your next visit.
This is especially helpful for users who frequently use the detailed list view. With its rich filtering, column sorting, and display options, this view acts as a powerful SLO explorer, allowing you to investigate your SLOs from various perspectives.
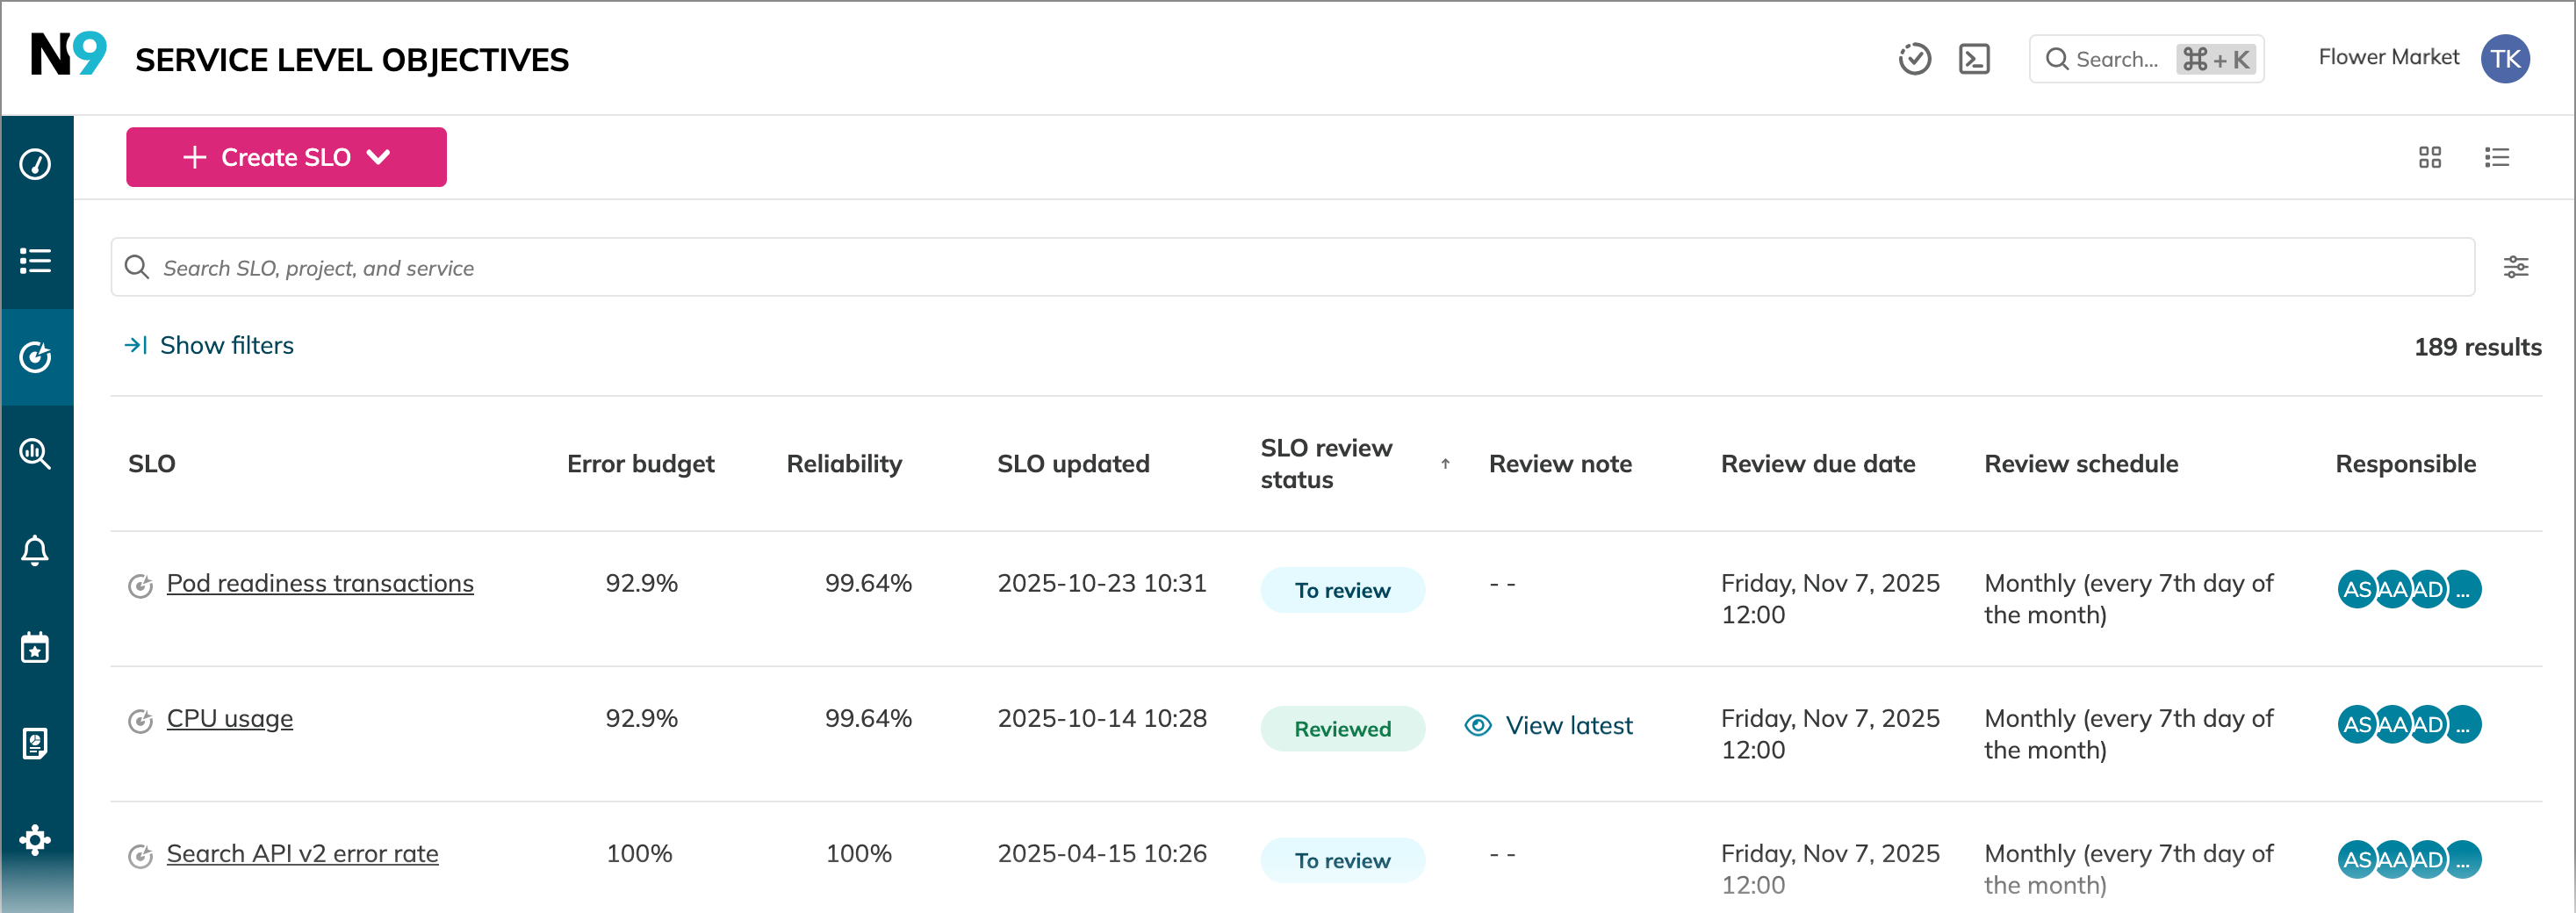
You can switch between the grid and list views using the buttons in the upper-right corner of the Service level objectives page:
improved Hide Ungrouped SLOs in System Health Review reports
For a cleaner, more focused view in your System Health Review reports, you can now hide the Ungrouped SLOs row. This new option is available when using the Label value rows grouping.
The Ungrouped SLOs row gathers all SLOs that meet your report's filter criteria but do not have the specific label used for grouping. By hiding this row, you can focus your analysis on the categorized SLOs that are most relevant to you.