Managing SLO annotations in the UI
User annotations
User annotations are displayed on the SLO charts with the following icons:
-
 icon for user annotations with specified Start date
 -
 icon for user annotations with specified Start date and the End date
Adding annotations
You can easily add annotations to your existing SLOs using the Nobl9 UI:
-
Go to Service Level Objectives in the main navigation panel.
-
In the SLO grid view, choose the SLO where you want to add your annotation and click it:
Video 1: Choosing a relevant time point in SLO to add annotation In the SLO details view, you can add annotations to:
-
The SLI chart.
-
The reliability burn-down chart.
-
The error budget burn rate chart.
-
-
Hover over any of the charts, choose a relevant time point on any of the above-mentioned charts, and click the chart to add annotation.
-
You will see a blue line and a pin icon which marks the annotation. In the pop-up window, provide the following information, that is, a description, specify the Start Date and End Date, and click the Add Annotation button.
-
The Start date and the End date fields will be pre-filled with the date of adding the annotation. You can change those values by clicking the Calendar icon.
-
If the Start date = End date, the annotation will be displayed as a single point in the chart.
Video 2: Adding annotation to the SLO - If the End date is later than the Start Date, the annotation will be displayed as a greyed-out area in your chart:
Video 3: Configuring Start and End date -
Your added annotation will be displayed on every chart in SLO details.
-
You can add annotations in the overlapping timespans.
-
-
You will be able to see your annotations whenever you hover over them on any of the charts in the SLO details view:
Video 4: Displaying the added annotation
Deleting annotations
You can easily delete your annotations in the UI:
-
In the SLO details, hover over the annotation that you want to delete.
-
On the annotation details pop up, hover over the annotation that you want to delete.
-
Click the Trash icon, and click the Delete button to confirm:
Video 5: Deleting the annotation
Managing system annotations
Each time an alert was triggered or resolved, by default, Nobl9 adds an annotation on the SLO objective charts. Such annotation is displayed as a time range with startTime representing the timestamp when the alert was triggered and endTime representing the timestamp when an alert resolved or canceled.
System annotations are displayed on the SLO charts with the following icons:
-
 icon for system annotations with specified Start date
 -
 icon for system annotations with specified Start date and the End date
System annotations are displayed regardless of whether an Alert policy is silenced. That is, even if you silence an Alert policy for a given SLO, Nobl9 will create the annotation for the silenced alert and display it on the SLO charts.
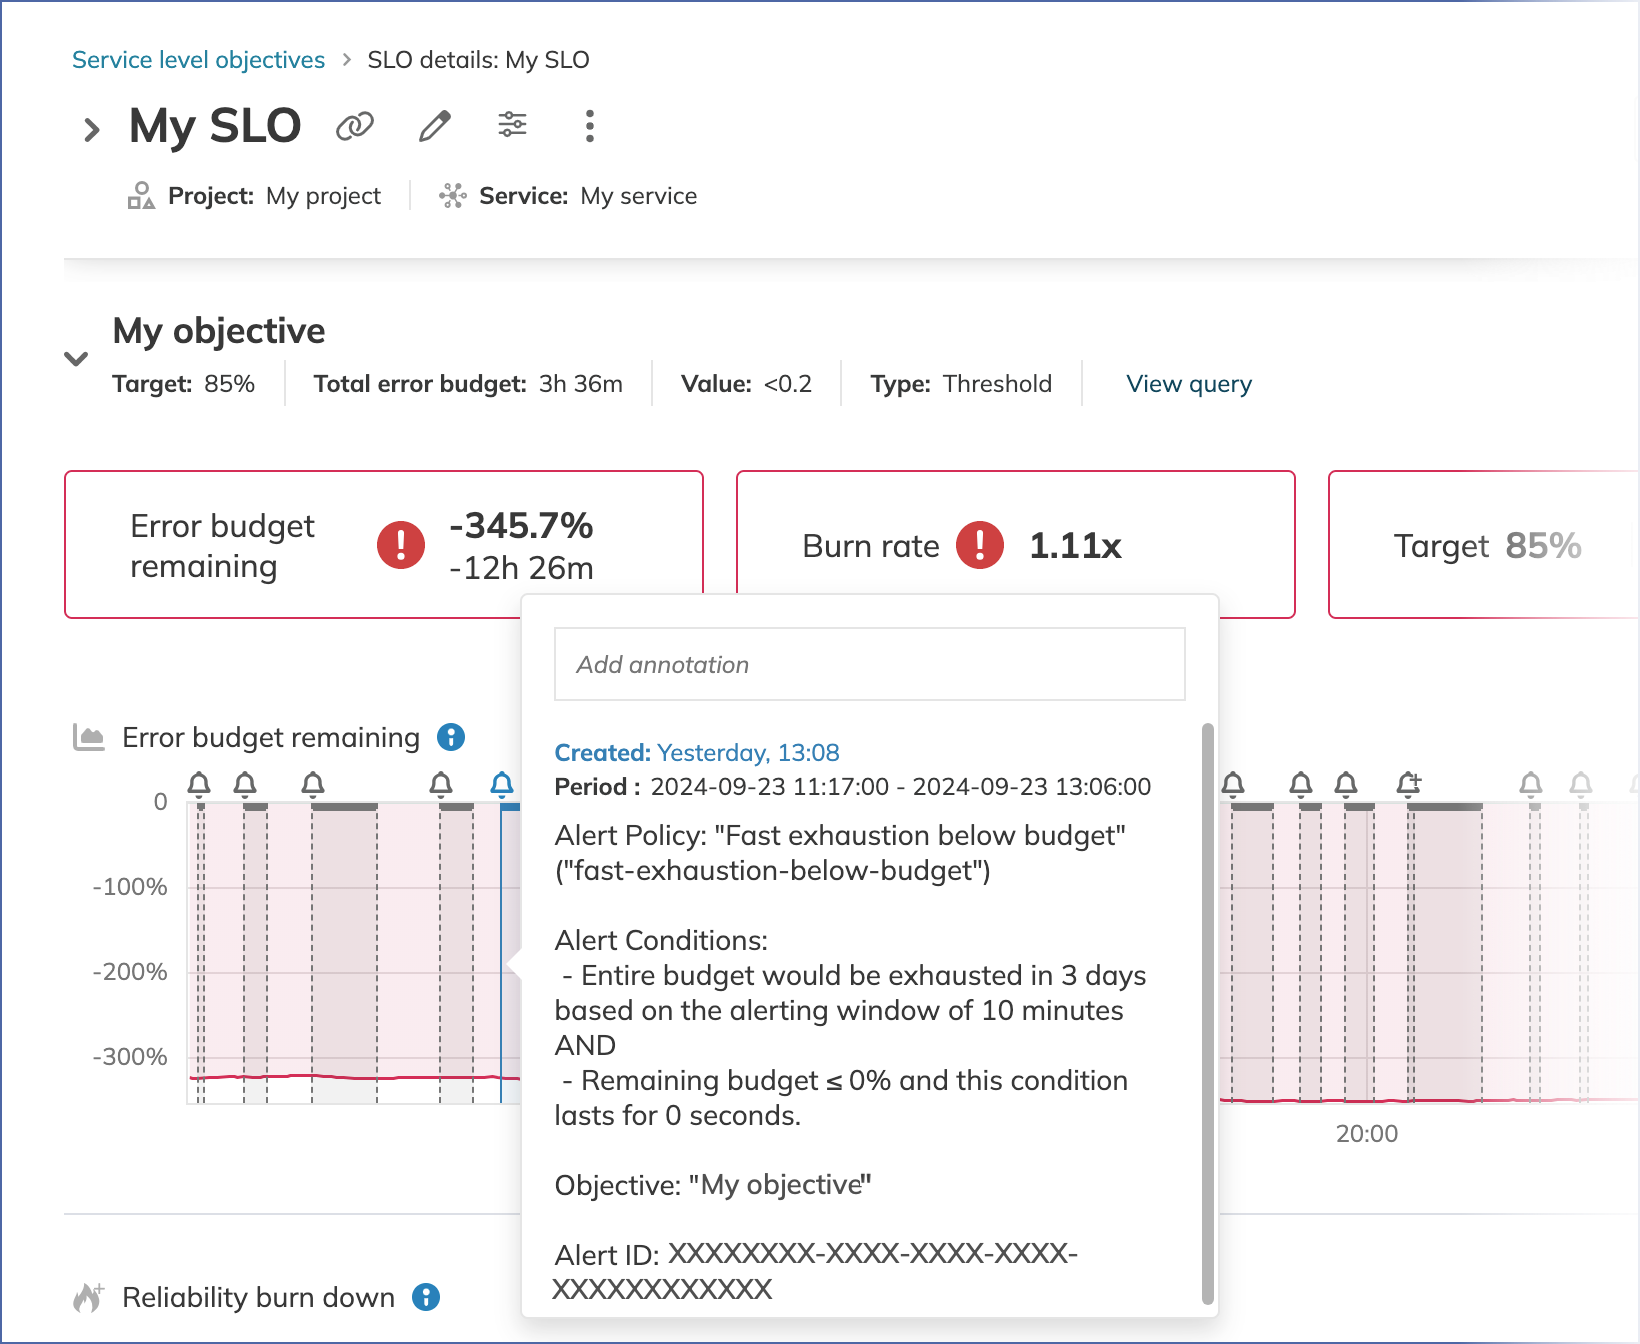
If an alert was triggered but not resolved yet, you can only see one annotation pin including only the startTime - not a time range.
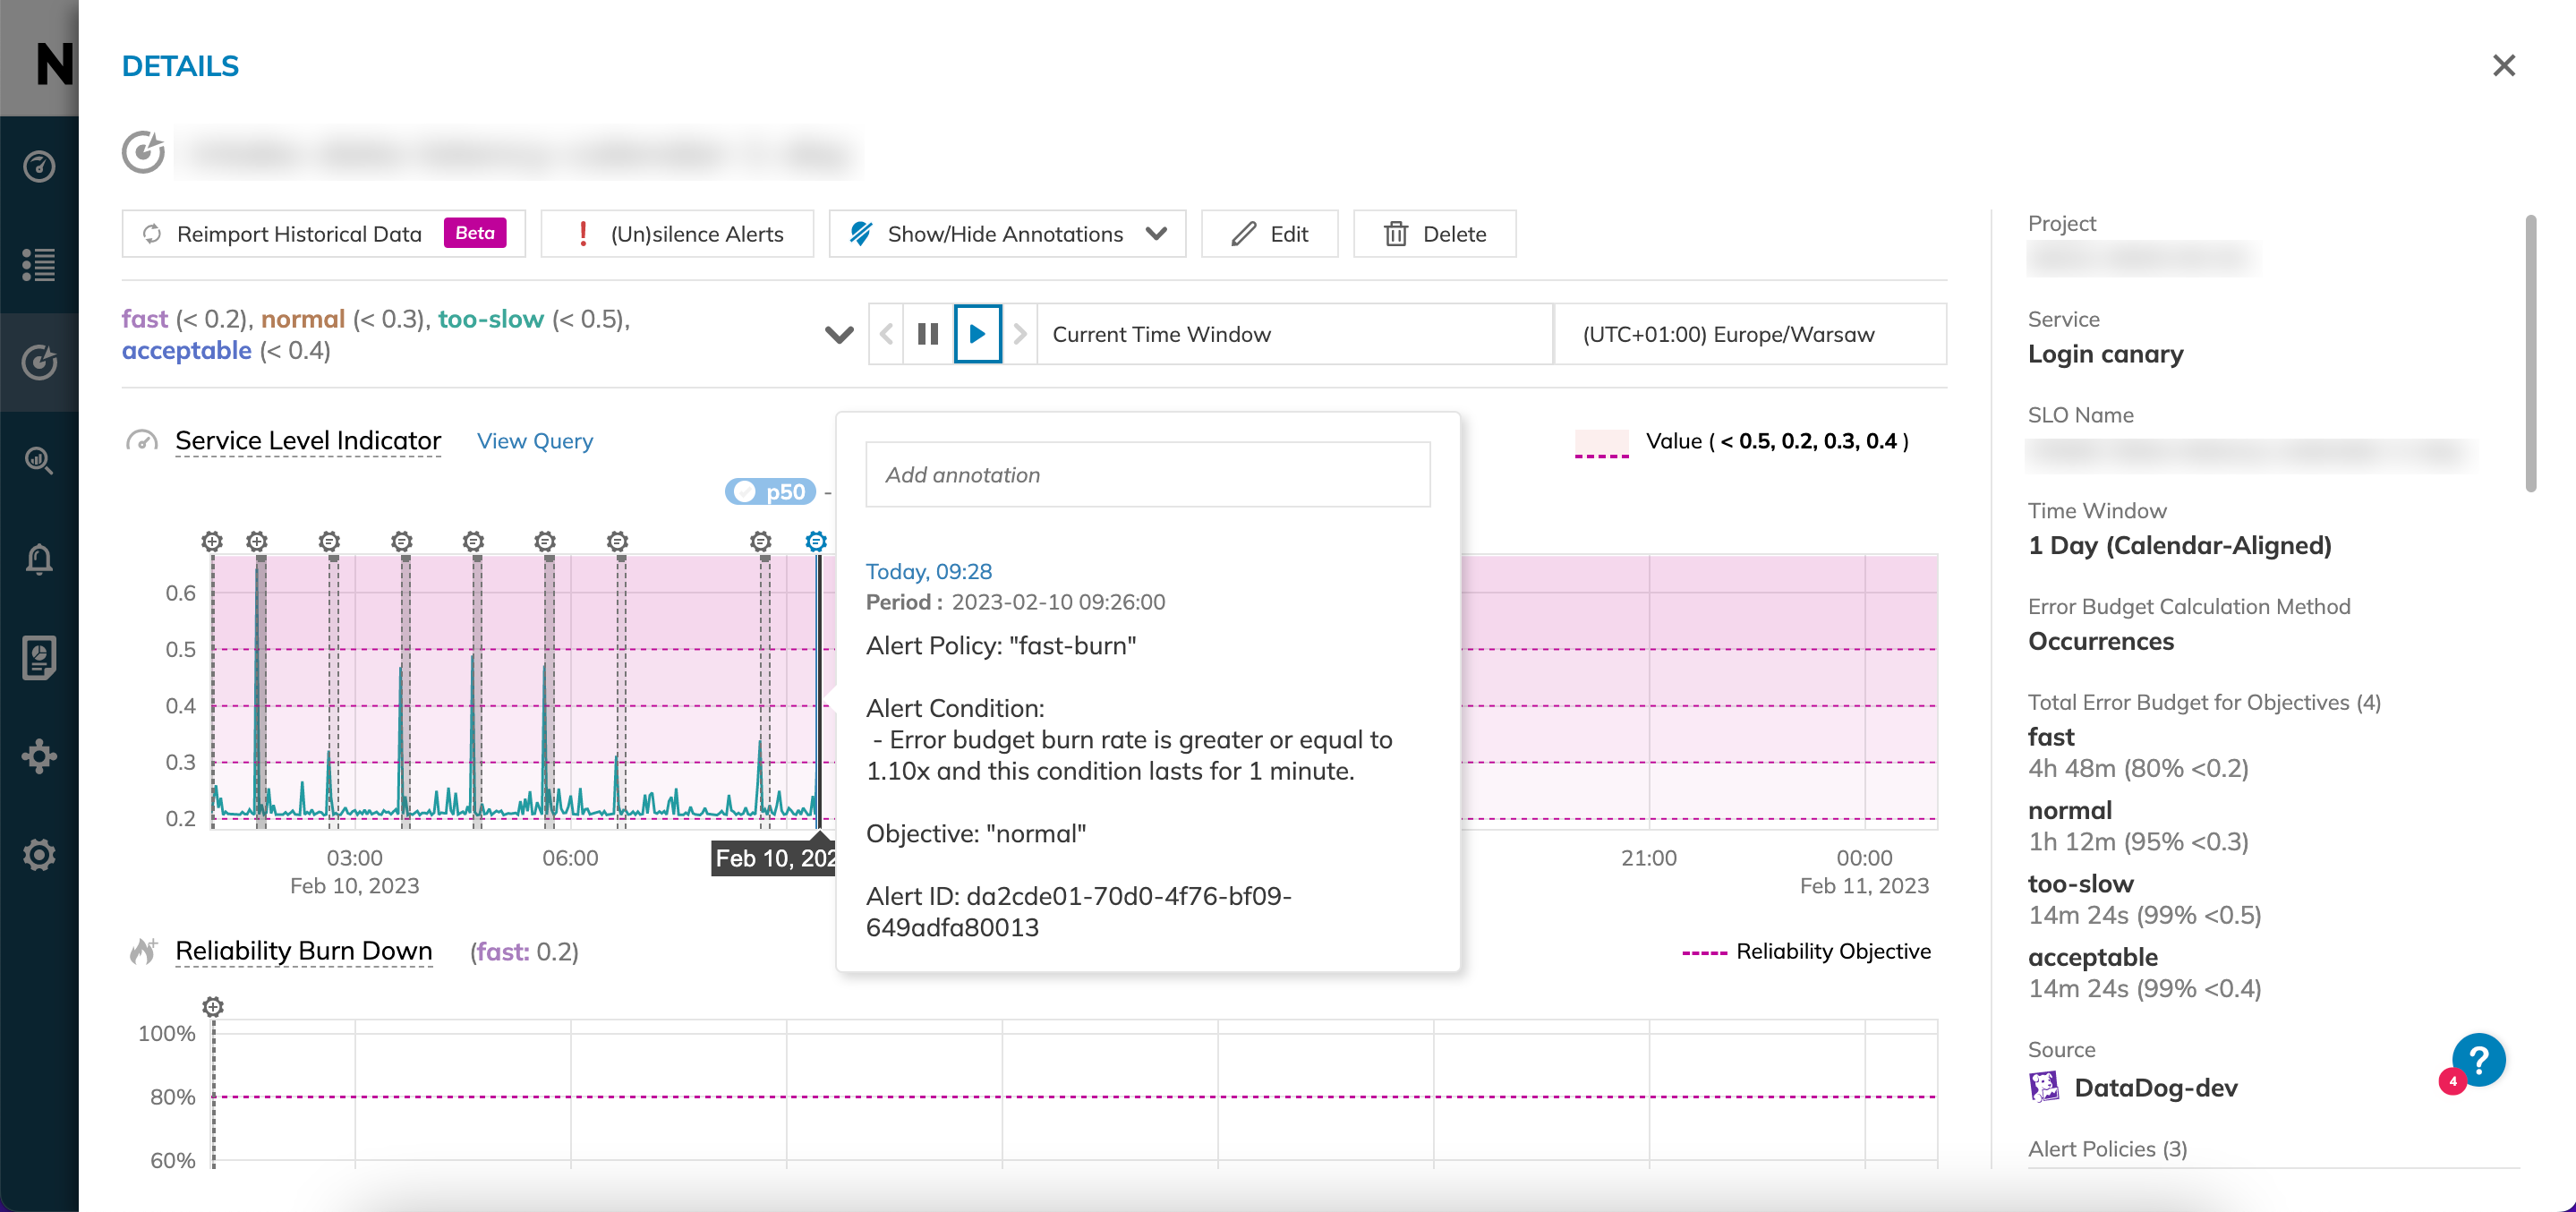
System annotations regarding alerts are created based on metric timestamp. Those annotations represent the time when an SLI indicates that alert was triggered or resolved. For the delayed metrics, Nobl9 will draw annotation in the past - note that it is not related to time when you receive a notification.
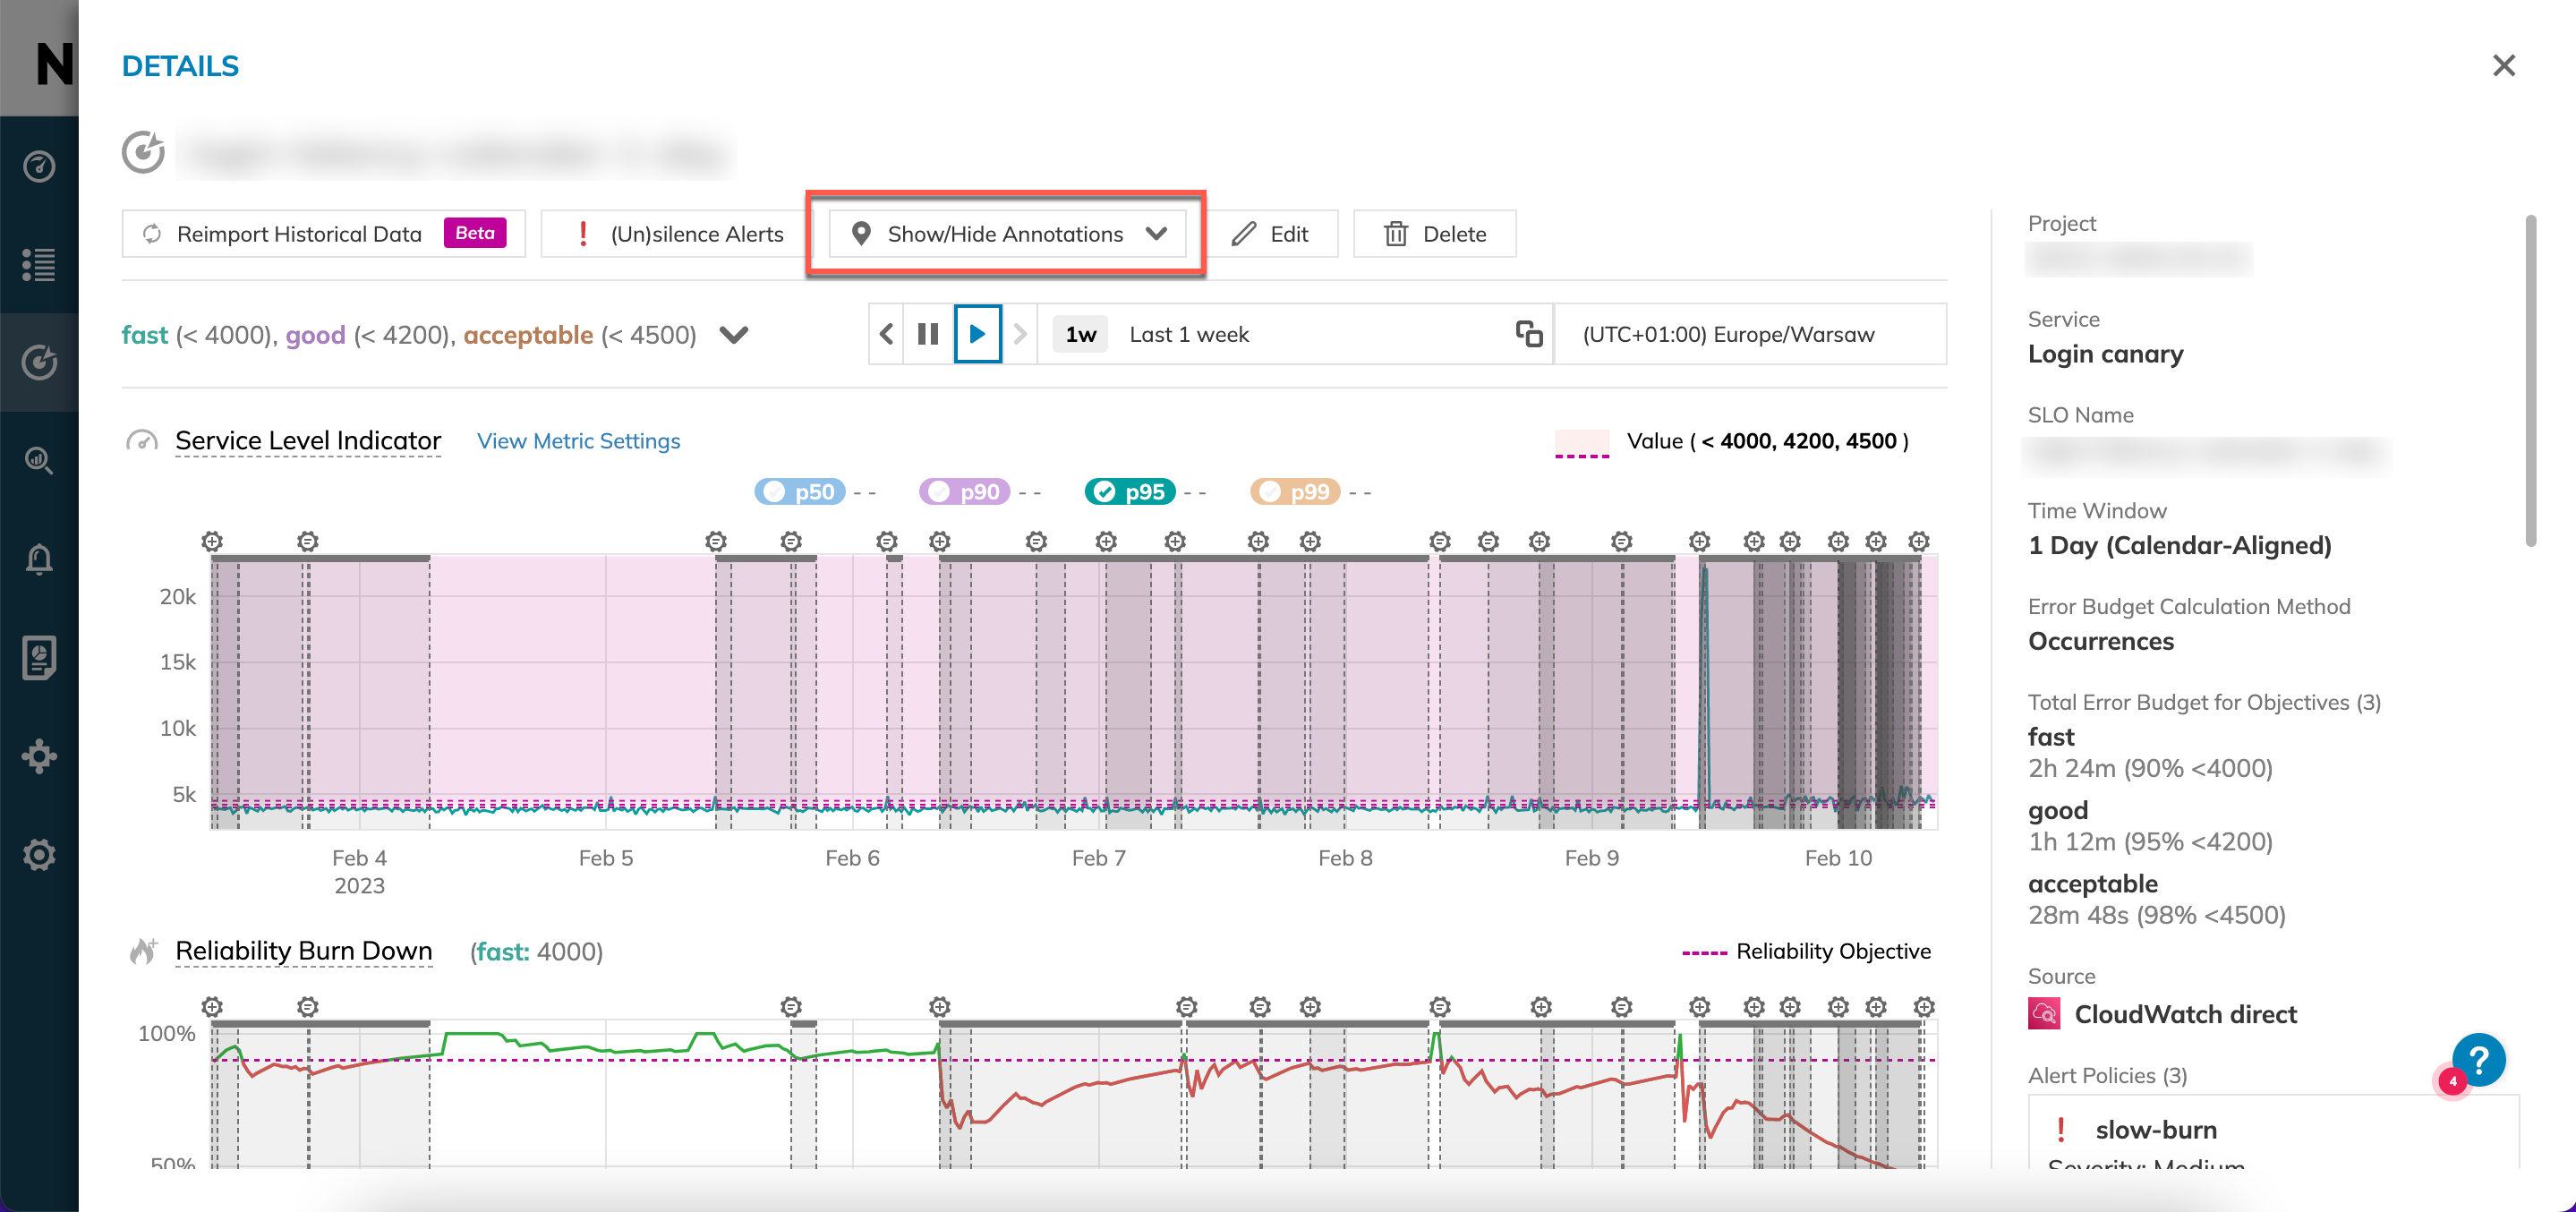
Show and hide annotations on SLO charts
You can easily show or hide all annotations displayed on the SLO details. You can choose whether to show system annotations, user-created annotations, or both. To apply these settings, follow these steps:
-
Go to Service Level Objectives in the main navigation panel.
-
In the SLO Grid view, choose the SLO where you want to show annotation, and click it.
-
In the SLO details view, click the Show/Hide Annotations button:
- In the pop-up window:
- check the Show System Annotations checkbox if you want system annotations to be displayed on the SLO charts, or
- check the Show User Annotations checkbox if you want the annotations added by users to be displayed on the SLO charts.
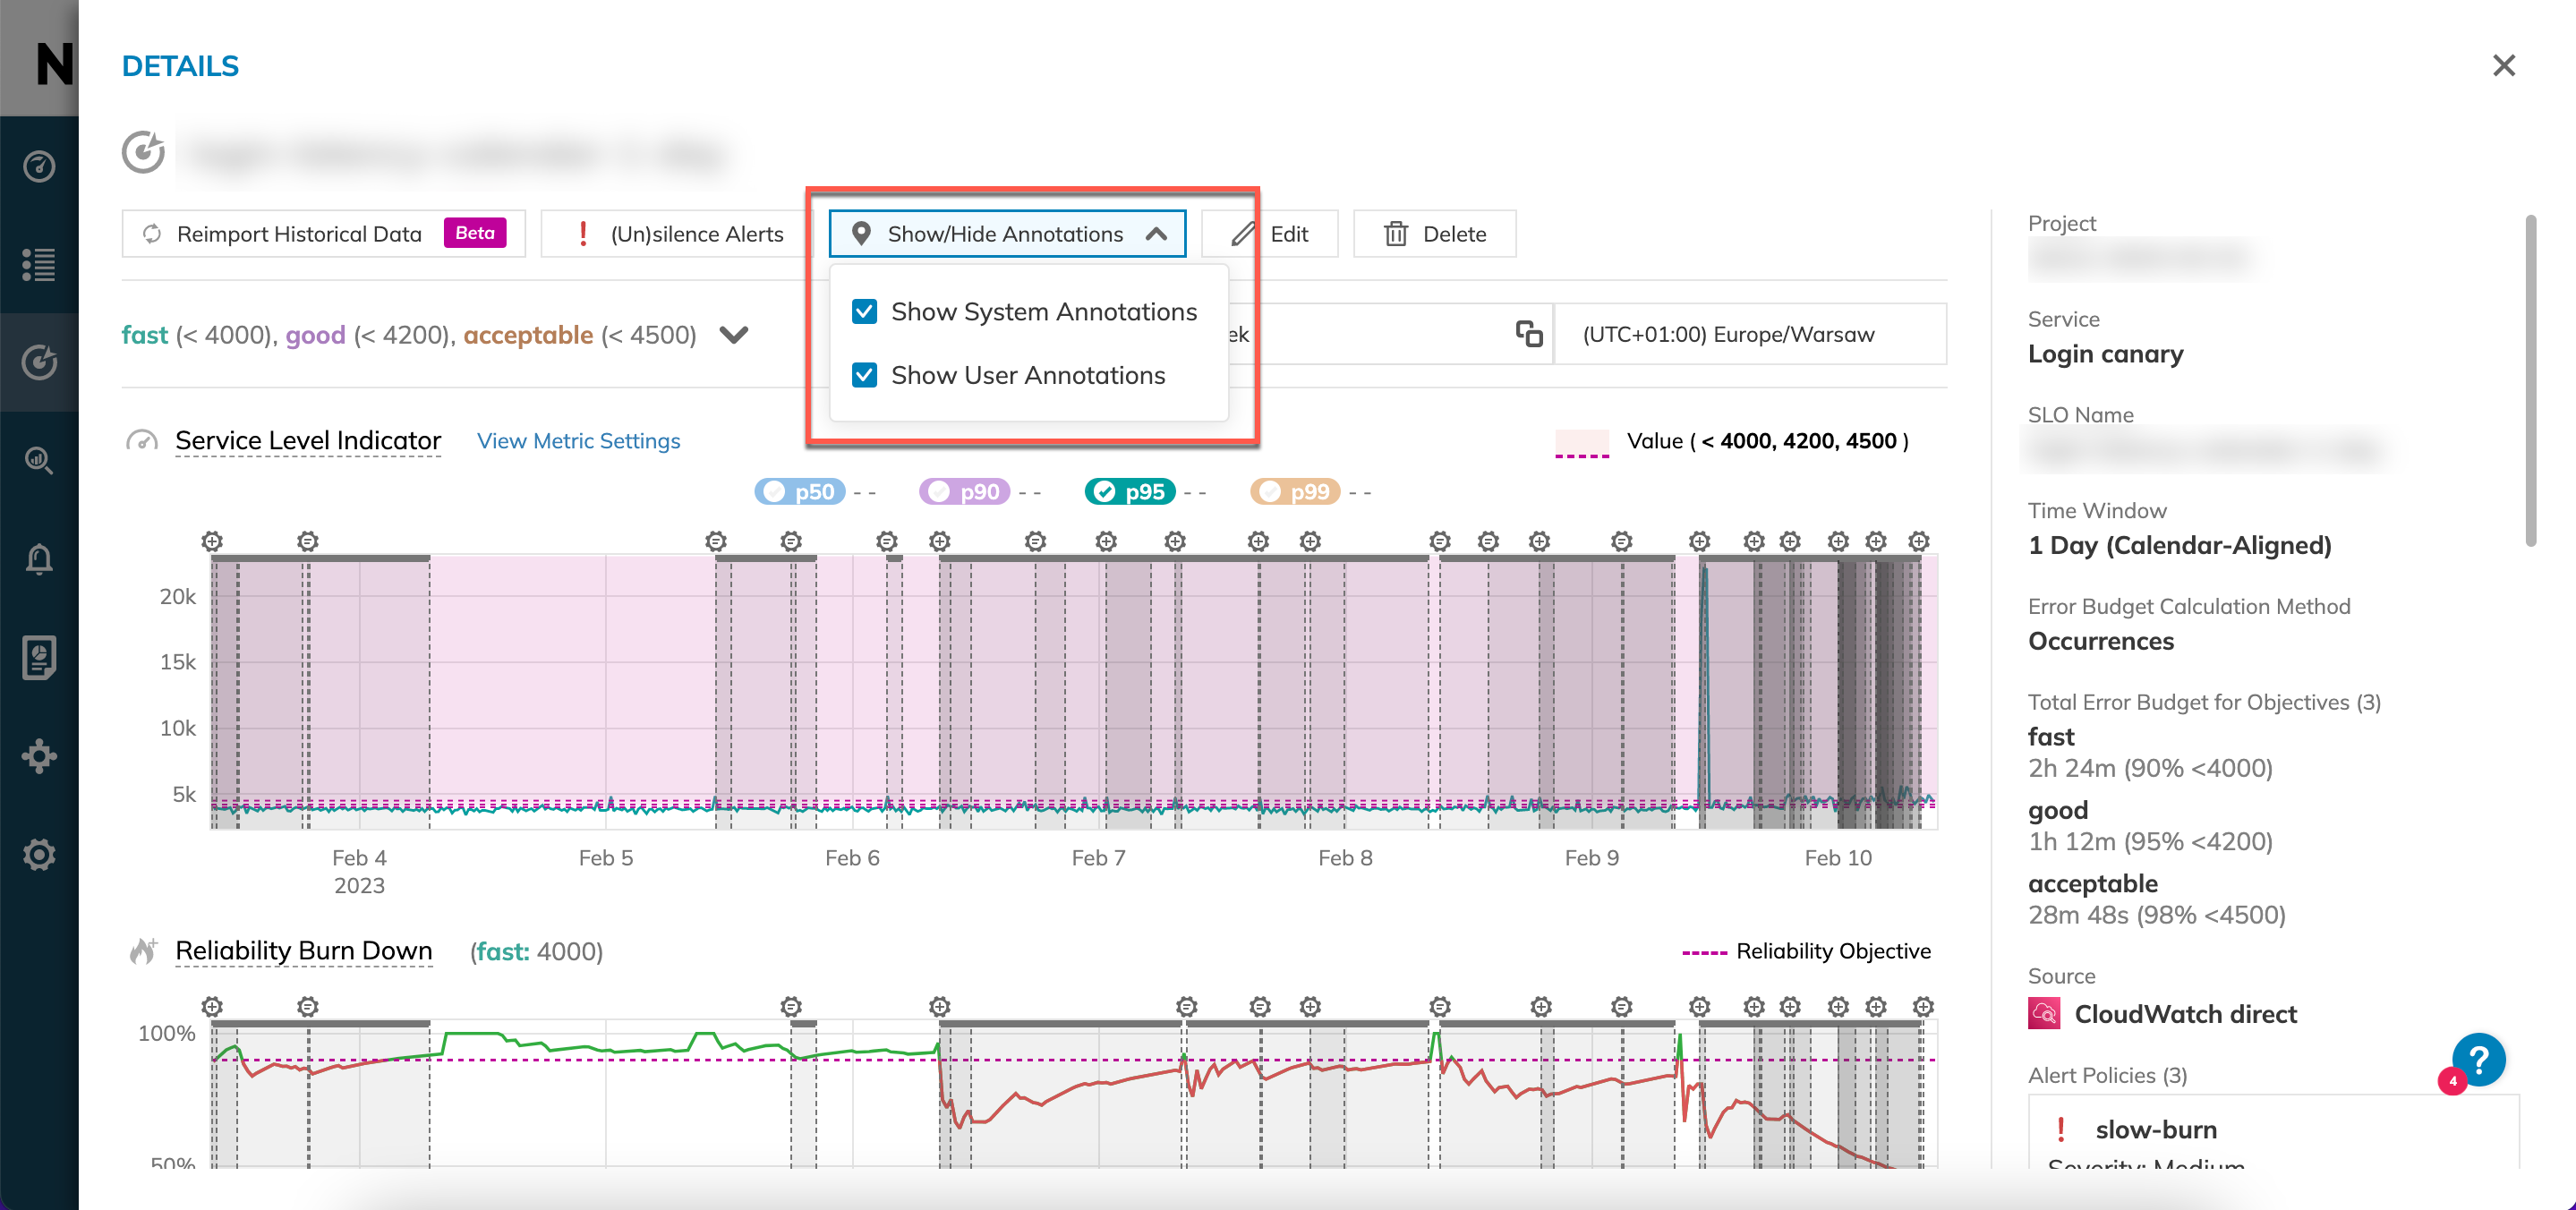
You don't need to change these settings every time you open the SLO details. The previously applied settings are saved until you change them again.