Glossary
Nobl9 is designed to be easy for everyone to use, including those without any developer or SRE experience. That said, we acknowledge that SLOs can be complicated! Below, you'll find a list of terms commonly used in Nobl9 to help you easily navigate through our platform.
countMetrics), keep in mind that the values resulting from that query for both good and total:- Must be positive.
- While we recommend using integers, fractions are also acceptable.
- If using fractions, we recommend them to be larger than
1e-4=0.0001. - Shouldn't be larger than
1e+20.
Terms
A
Agent
The Nobl9 agent is a lightweight application that executes the queries defined for Nobl9 SLOs. Users can run the agent to retrieve SLI metrics from their configured data sources and send the data back to the Nobl9 backend. Queries are written in the language supported by the data source in question and executed via native APIs. The agent can be deployed in a Kubernetes cluster or as a Docker container.
When you configure an agent connection to a data source (as opposed to a direct connection - see Direct data source integration), Nobl9 does not make direct calls to your environment. You pass in your credentials when launching the agent, and those credentials are not stored in the Nobl9 backend. Moreover, the Nobl9 agent can be used to collect and return data even if your company's firewall blocks outbound connections.
Alert method
When an alert is triggered, Nobl9 can automatically send a notification to an external tool, a REST endpoint (web service), or an email address. alert methods can be associated with all available alert integrations.
Alert policy
An alert policy is a set of conditions (triggers) you want to track or monitor. These conditions determine what is monitored and when to activate an alert: when the performance of your service falls under the defined threshold, Nobl9 will send a notification to a predefined channel (depending on the specified alert method).
Each escalation threshold should be represented by a different alert policy with different severity levels (see Severity).
Annotations
SLO annotations let Nobl9 users add notes to their metrics, which can be displayed in charts, annotation lists, and reports.
C
Calendar-aligned time windows
A time window in Nobl9 refers to the period of error budget calculation.
Calendar-aligned time windows are bound to calendar intervals. For example, you can configure your SLO's error budget to be restored weekly, every two weeks, monthly—up to one year. This facilitates time-based reporting on the health of your service—when you tie your error budget to something like a calendar month, people know exactly when the error budget will return in full.
Cooldown
The cooldown period is an interval measured from the last timestamp when all alert policy conditions were met. If the defined cooldown period passes without those conditions being met again, the alert event is resolved.
Component status
In Organization status, a component status is an indicator of component performance. It depends on the presence and severity of an impacting disruption. The available component statuses are:
- Operational
- Degraded performance
- Major outage
D
Data export
Data export is a premium Nobl9 feature that allows users to export their SLO data (the raw time-series budget burndown for all services in an account) to CSV files or directly to a Snowflake warehouse. The data is exported to an S3 bucket defined as a destination once per day.
Disruption
In Organization status, a disruption is an unwanted event that occurs in a component and leads to decreased performance.
Disruption state
In Organization status, a disruption state is an indicator of a disruption lifecycle. The available disruption states are:
- Impacting (active)
- Cleared (historical record)
Disruption trigger
In Organization status, a disruption trigger is the way a disruption is detected and registered. The available disruption triggers are:
- Auto
- Manual
Direct data source integration
Nobl9 users can choose between a direct or agent configuration (see Agent) when connecting to a data source. A direct connection requires users to enter their authentication credentials (API key, token, etc.), which are encrypted and safely stored in Nobl9. These credentials are then used to connect directly to the external source in order to gather metrics data. The customer does not need to install anything on their server.
E
Error budget
The error budget is the portion of requests that can fail over a defined period of time without incurring an SLO violation. It relies on the targets set up in your SLO.
From Implementing Service Level Objectives by Alex Hidalgo:
"An error budget is a way of measuring how your SLI has performed against your SLO over a period of time. It defines how unreliable your service is permitted to be within that period and serves as a signal of when you need to take corrective action."
Error budget burn rate
The burn rate shows how much of the error budget would be used up in the SLO time window if the number of bad events stays the same. For better granularity and immediate understanding of the system performance, the burn rate is always calculated for the last minute in Nobl9 charts.
Depending on the error budget calculation method, burn rate values can indicate the following:
| Value | Occurrences | Time Slices |
|---|---|---|
0 | No bad data points in the last minute | The last minute was good or no data available |
0 < value < 1/budget | Last minute contained good and bad data points | N/A |
1/budget | All data points in the last minute were bad | The last minute was bad |
Assuming the number of errors remains constant throughout the SLO time window, we can anticipate the following scenarios based on the burn rate:
-
Burn Rate
< 1:
The error budget will not be entirely consumed by the end of the time window. This indicates that the error rate is below the target, and the system performs better than expected. -
Burn Rate
= 1:
The error budget will be entirely exhausted by the end of the time window. This implies that the error rate is aligned with the target error rate, and the system performs as expected. -
Burn Rate
> 1:
The error budget will be exhausted before the time window ends. This indicates that the error rate exceeds the target error rate, and the system is not meeting expectations.
Error budget calculation method
Nobl9 offers two error budget calculation methods: Occurrences and Time Slices. The budgeting method you select determines whether the error budget will be calculated based on the count of good attempts vs. total attempts or the count of good minutes vs. total minutes in the time window defined for your SLO.
H
Health status
The Service health dashboard displays information on the health of your services based on the error budgets or burn rates for their defined SLOs. The following are the definitions of the possible statuses:
| Status by error budget (EB) | Status by burn rate (BR) | Description |
|---|---|---|
| Healthy | Low | EB: All SLOs in this service have more than 20% of their error budget remaining BR: All SLOs in this service have burn rate lower than your threshold |
| At risk | Medium | EB: All SLOs in this service still have some remaining error budget, but at least one has less than 20% of its error budget left BR: At least one SLO in this service has the burn rate equal to your low threshold value or more, but no more than the high threshold value (not including it) |
| Exhausted | High | EB: At least one of the SLOs in this service has already burned its error budget for the current time window, and at least one SLO has less than 20% of its error budget left BR: At least one SLO in this service has the burn rate equal to the high threshold value or greater |
| No data | No data | There is no data available for the service’s SLOs This can occur when any of the SLOs in a service has a query interval or query delay values, or their combination greater or equal to the dashboard's time window, so there is not enough time to accumulate data for categorization. |
I
Indicator
An indicator is a unique query that defines a metric in a given data source that describes some property of the observed service. The same indicator can be used in one or more SLOs.
Issue
In Organization status, an issue is a signal that contributes to the issue threshold used to detect disruptions. It can represent downtime, an error, an incident, or other unexpected behavior.
Issue source
In Organization status, an issue source is the way an issue was received. The available issue sources are:
- User
- Nobl9 SLO
- External telemetry
L
Labels
Labels are key-value pairs that can be attached to SLOs, services, and alert policies in the Nobl9 platform. They allow users to define attributes of resources and use them to filter and group SLOs across services in the SLO grid view and reports. Each label must be unique for a given SLO, but many SLOs can carry the same label.
M
Metric
A metric is a formula that uses measurements to determine how well the system performs in a specific situation. SLI metrics in Nobl9 are any two-dimensional sets of data where changes in a certain value are distributed over time. Nobl9 supports two types of metrics: ratio metrics and threshold metrics (see below).
O
Objective
Objectives are the thresholds for your SLOs. Nobl9 users can use objectives to define the tolerance levels for their metrics.
Occurrences
One of the two available error budget calculation methods. With the Occurrences method, we count the number of good attempts out of all attempts made. This method is well suited to measuring recent user experience, and since there are fewer total attempts during low-traffic periods, it automatically adjusts to lower traffic volumes. See also Time Slices.
P
Project
Projects are the primary logical grouping of resources across the Nobl9 platform. All Nobl9 resources are created within a project. Access controls at the project level let users control who can see and change these resources. The resources that can be grouped under a project include:
-
Services
-
SLOs
-
Data sources
-
Alert policies
-
Alert methods
Q
Query parameters
Query parameters improve the consistency and integrity of the incoming data between your data source and Nobl9.
-
Query delay defines the time range offset for data collection.
For example, with a0mquery delay, the Nobl9 agent calls for data from 14:50–15:00. With a10mquery delay, the Nobl9 agent calls for data from14:49–14:50. -
Query interval defines how often the Nobl9 agent requests data from your data source.
For example, with a10mquery interval, the Nobl9 agent queries data for the last 10 minutes every 10 minutes. -
Jitter defines the deviation of request frequency from Nobl9 to your data source.
For example, with a0mjitter and10mquery interval, Nobl9 requests data every 10 minutes, say, at15:00:00.
Although with a15sjitter, data is requested at a random point between15:00:00and15:00:15. -
Timeout defines how long the Nobl9 agent waits for a data source to respond upon sending a query.
For example, with a15stimeout, if the agent runs a query at15:00:00, the data source must finish returning data by15:00:15, otherwise the query fails by timeout.
You can access your data source query parameters:
- From your data source details
- From your SLO details
- By running the
sloctl get [agents | directs]command
You can modify the query delay for your data source
using the Nobl9 Web App,
sloctl, or the Nobl9 Terraform provider.
All other parameter values are displayed for informational purposes only. To modify them, contact Nobl9 support.
When you apply changes to the query interval, jitter, or timeout through YAML definition of your agent or direct, it will have no effect on the actual data source configuration.
R
Ratio metrics
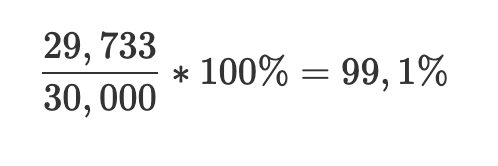
A ratio metric is an SLI metric composed of two time series that allows you to determine the percentage of "good" events by dividing that number by the total number of events.
As an example, suppose you own a website with roughly 30,000 visitors every day. 29,991 of these visits result in the website loading within the target of 0.5 seconds. Knowing this, you can calculate your ratio metric by dividing the number of good requests (the numerator) by the total number of requests (the denominator) and multiplying it by 100%:
countMetrics), keep in mind that the values resulting from that query for both good and total:- Must be positive.
- While we recommend using integers, fractions are also acceptable.
- If using fractions, we recommend them to be larger than
1e-4=0.0001. - Shouldn't be larger than
1e+20.
RBAC
Role-based access control (RBAC) in Nobl9 ensures access management in the Nobl9 platform. It is aimed to ensure granular user permissions and access to resources with project-level and organization-level roles.
Reliability burn down
The reliability burndown rate is closely related to the error budget status but focuses more closely on the percentage of recent events that have reported a good versus bad status. It measures how your service has performed over time and gives you better data to discuss whether you need to fix or develop your service further.
Role binding
A RoleBinding is a YAML object related to RBAC in Nobl9. A single RoleBinding object allows the definition of the relation between exactly one user and exactly one role.
Rolling time windows
A time window in Nobl9 refers to the period of error budget calculation.
A rolling time window moves as time progresses. This ongoing movement ensures that older data points are regularly discarded and replaced with new ones.
For instance, if you have a 30-day window and a 10-second resolution, your error budget will be updated every 10 seconds as the time window moves forward. As a result, good data points can replace the bad ones leading to the error budget recovery.
S
Service
A service in the Nobl9 platform is something that can be tested for reliability. It can represent a logical service endpoint like an internal or external API, a database, or anything else you care about setting an SLO for, such as a user journey. In Nobl9, services are organized under projects.
Service level indicator (SLI)
A service level indicator is a metric used to determine whether a service achieves the defined service level objective. This could, for example, be the number of successful requests against the service over a given time period when performing performance monitoring.
Service level objective (SLO)
A service level objective is an actual target value (or range of values) for the availability of the service, which is measured by a service level indicator. SLOs allow you to define the reliability of your products and services in terms of customer expectations. Nobl9 users can create SLOs for user journeys, internal services, or even infrastructure.
Each SLO can have one or more defined objectives (targets and values), with an indication of the user experience (e.g., Good or Acceptable) when that target is met.
Severity
The severity of an alert policy (see Alert policy) indicates the level of impact of a triggered alert event. Nobl9 users can define the severity level as follows:
-
High: A critical incident with a very high impact
-
Medium: A major incident with a significant impact
-
Low: A minor incident with low impact
sloctl
sloctl is a command-line interface (CLI) for Nobl9. The sloctl CLI can be used for creating or updating multiple SLOs and objectives at once as part of CI/CD.
SLO unit
An SLO unit represents the number of individual error budgets calculated by Nobl9. Each SLO contains at least one error budget, and every additional target set within an SLO adds another error budget. For instance, if a threshold metric has three targets, it amounts to three SLO units. In Nobl9 Web, each SLO unit appears as a separate tile on the SLO grid view.
See Nobl9 pricing for more details.
T
Threshold metrics
A threshold metric is an SLI metric composed of a single time series that represents a numerical property of a service that changes over time, such as the duration of an average HTTP response or CPU utilization. These values are evaluated against a set threshold. See also Threshold, Threshold target, and Threshold value.
Threshold objective value
The objective's value determines whether a raw indicator is considered “good” or “bad.”
When working with SLOs, Nobl9 uses the objective's value to ensure unique error budget calculations across different objectives.
As a result, each objective in an SLO must have its own distinct target value.
If you wish to use similar values for multiple objectives, we recommend making slight adjustments to the decimal points.
For example, if your initial value is set to 1 for two objectives,
you can change it to 1.0000001 for one objective and 1.0000002 for the other.
- apiVersion: n9/v1alpha
  kind: SLO
  metadata:
    name: my-slo
    project: my-project
    ...
    objectives:
    - countMetrics:
      ...
      name: objective-1
      target: 0.95
      value: 1.0000001
    - countMetrics:
      ...
      name: objective-2
      target: 0.91
      value: 1.0000002
Target
The lowest acceptable good/total ratio in a given time window that will ensure an objective to be considered as "met." For example, suppose you have a latency objective where you want responses to be returned in less than 100 ms (the threshold value; see below). If the target is set to 90%, for the Occurrences error budget calculation method this would be interpreted as “the response time of 90% of requests should be below 100 ms in a given time window.” For the Time Slices method, it would be interpreted as “the response time should be below 100 ms for 90% of the minutes in a given time window.”
Time slices
One of the two available error budget calculation methods. With the Time slices method, what is counted - i.e., the objective that is measured - is how many good minutes (minutes in which the system was operating within the defined boundaries) were achieved, compared to the total number of minutes in the time window. See also Occurrences.