Agent metrics
Monitoring the health and performance of the Nobl9 agent is crucial for ensuring reliable data collection. To facilitate this, Nobl9 exposes key metrics that provide insights into the agent's operational status and resource utilization.
These metrics, available for scraping at the /health and /metrics endpoints, allow you to verify that the agent is running optimally and to make any necessary resource adjustments.
You can activate metrics configuration by exposing your agent data using environmental variables in your Docker container or Kubernetes cluster.
To get the Nobl9 agent metrics, you need to have a monitoring solution that can scrape a Prometheus-compliant metrics endpoint.
Metric endpoints
| Endpoint | Example request | Response | Notes |
|---|---|---|---|
/health | curl -X GET http://<agent-IP>/health | HTTP/1.1 200 OK | OK means the agent code completed initialization and is running |
/metrics | ️ curl -X GET http://<agent-IP>/metrics | Available metrics | Text-based response handled by the Golang Prometheus libraries |
Agent's default port
To scrape agent's metrics,
define the N9_METRICS_PORT as an environmental variable in your agent configuration
when deploying it to Kubernetes or Docker:
- Kubernetes
- Docker
The example Kubernetes deployment YAML with the defined N9_METRICS_PORT variable:
apiVersion: apps/v1
kind: Deployment
metadata:
  name: nobl9-agent-example
  namespace: default
spec:
    <...>
    spec:
      containers:
        - name: agent-container
          image: nobl9/agent:0.110.0
          resources:
            requests:
              memory: "350Mi"
              cpu: "0.1"
          env:
            <...>
            - name: N9_METRICS_PORT
              value: "9090"
The example Docker deployment command with the defined N9_METRICS_PORT variable:
docker run -d --restart on-failure \
  --name nobl9-agent-example \
  -e N9_CLIENT_ID="unique_client_id" \
  -e N9_CLIENT_SECRET="unique_client_secret" \
  -e N9_METRICS_PORT="9090" \
  nobl9/agent:0.110.0
N9_METRICS_PORT configuration- Purpose: Specifies the TCP port for the
/metricsand/healthendpoints. - Default:
9090. You can change this value to suit your needs. - To disable: Remove this variable to stop exposing the endpoints.
Available metrics by version
| Metric name | Type | Labels | Description |
|---|---|---|---|
n9_accumulated_points | countervec |
| Points added to the accumulator since the agent start |
n9_all_buffer_metrics_dropped | counter | Total number of dropped metrics due to the buffer overflow, unlabeled | |
n9_buffer_capacity | gauge | Total capacity of the metrics buffer in the Nobl9 agent | |
n9_buffer_load | gauge | Total count of metrics in the buffer that has not yet been successfully uploaded to the Nobl9 platform | |
n9_bytes_received_total | counter | Total count of bytes received by the agent since the last start | |
n9_bytes_sent_total | counter | Total count of bytes sent since the last agent start | |
n9_emitted_points | countervec |
| Points successfully emitted to the N9 platform since the agent start |
n9_input_sent_bytes | counter |
| Bytes sent in input requests’ bodies since the last agent start |
n9_last_config_update_success_time | gauge |
| Seconds since the last successful config read |
n9_last_input_successful_response_time | gauge |
| Seconds since the last successful input response |
n9_last_upload_success_time | counter | Seconds since the last successful data upload | |
n9_output_received_bytes | counter | Bytes received in output responses’ bodies since the last agent start | |
n9_output_sent_bytes | counter | Bytes sent in output responses’ bodies since the last agent start | |
n9_query_lag | histogramvec |
| Histogram of SLO query lag by organization, plugin name, metric source |
n9_query_latency | histogramvec |
| Latency histogram of all SLI query requests |
n9_query_time_range | histogramvec |
| Time range histogram of all SLI query requests per organization, plugin, and metric source |
n9_query_total | countervec |
| Total count of all queries ran since the last agent start |
n9_skipped_points_out_of_time | countervec |
| Count of skipped points due to being requested out of time range. LogicMonitor only |
n9_sli_total | gaugevec |
| Total count of the SLIs the agent collects data for |
n9_upload_latency | histogramvec |
| Latency histogram of all data uploads by SLI to the Nobl9 platform |
n9_upload_total | countervec |
| Total count of all data uploaded to the Nobl9 platform since the last agent start |
n9_uptime | counter |
| Seconds since the agent start |
The slo_name label (available since Nobl9 agent v0.98.0 / v0.98.0-beta and later)
is applicable when N9_METRICS_INCLUDE_SLO_LABELS=true.
This feature is disabled by default to prevent potential high-cardinality issues in agent metrics.
Key points:
- When several SLOs share the same query, the first SLO (alphabetically) is used
- For multi-indicator integrations where multiple queries are combined in one request, the first SLO is used with the
batchprefix - Check your data source logs to correlate all SLOs using a particular query
Metrics usage
Agent metrics offer crucial insights into the Nobl9 agent's performance and health within your Kubernetes environment. By visualizing these metrics, you can effectively diagnose operational issues and monitor resource usage. Here are a couple of examples:
Monitoring memory utilization
If you notice a spike in the agent's memory consumption, you can analyze its memory usage over time. This helps identify the cause, such as high query load or specific data source configurations, allowing you to optimize resource allocation.
Troubleshooting operational pauses
An agent might appear to be running in Kubernetes but periodically stop sending data. Analyzing the following metrics can help pinpoint the problem:
n9_upload_total{status_code!~"200"}: A spike here indicates failed data uploads to Nobl9.n9_bytes_sent_total: The graph for this metric stops growing, showing that data transmission has halted.n9_last_upload_success_time: This metric shows the timestamp of the last successful upload, confirming the pause.n9_buffer_load: This value will steadily increase as the agent queues data it can't send.
Together, these metrics strongly suggest a connectivity issue. This information is valuable for further troubleshooting with your networking team or Nobl9 support.
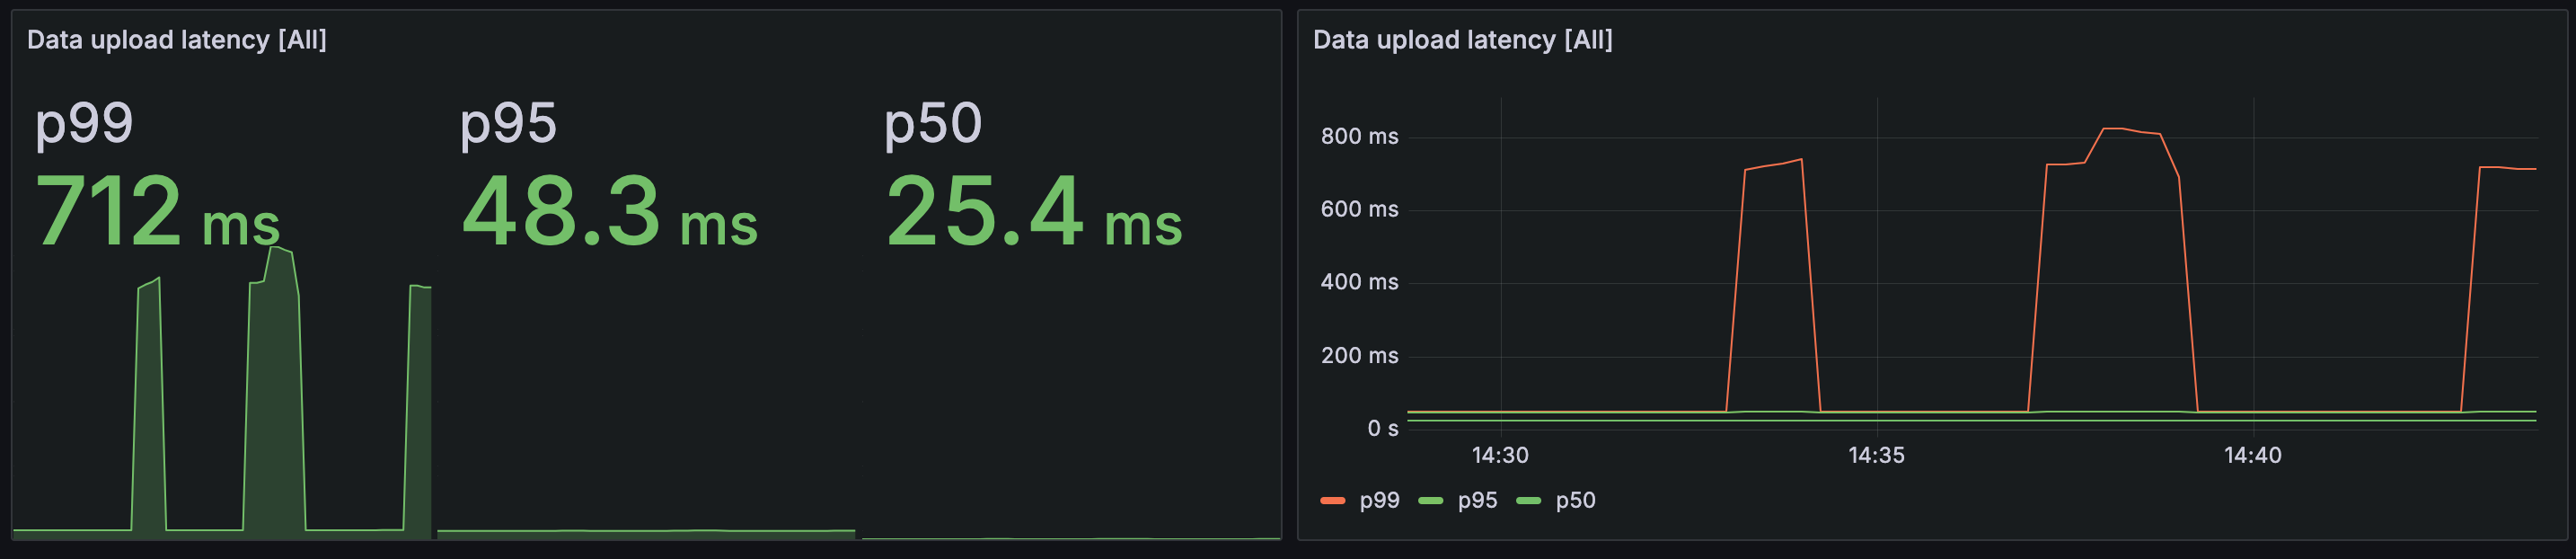
Metrics visualization in Grafana
Using Prometheus, you can collect metrics and analyze them with the Nobl9 agents Grafana dashboard.
n9_query_latency:

n9_upload_latency: