Pinpoint targets with SLI Analyzer
In the previous chapter, we discussed SLO creation and understanding its output. Now that you have a basic grasp of service reliability and performance monitoring, let's tackle one of the most challenging aspects: choosing the right reliability targets for your SLO. Instead of relying solely on trial-and-error—which can take weeks—there’s a more efficient approach using the SLI Analyzer.
Setting the right SLO reliability targets is crucial for maintaining high service reliability and customer satisfaction. With the SLI Analyzer at your disposal, you can retrieve historical data and try different reliability targets to observe how your system performs. Once you’ve determined the right target using your existing data, create a new SLO.
To begin, open the SLI Analyzer in Nobl9:
- Go to the SLI Analyzer section on the Nobl9 Web.
- Click
 .
.
Step-by-step
- First: import data
- Next: analyze data
To create an analysis, you must first import the SLI data. To do so, follow these steps:
- Enter the analysis Name.
You can enter a user-friendly name with spaces. - Select your required data source.
It must be previously added as your Nobl9 integration. You can select any data source supported by SLI Analyzer. - Specify the Metric and provide a query.
Need a refresher? See metric types and data count methods.SLI Analyzer performs best with data that is sufficiently dense and diverse.
For ratio metrics, ensure both the numerator and denominator queries return distinct results. - Specify the Graph Time Window.
For accurate error budget calculations, set a time window of at least 5 minutes.
- Select the Time Zone for your analysis.
- Click Import Data.
Depending on the data source’s API, data import can take 2–45 minutes. If the process takes longer, contact support@nobl9.com.
When the data is successfully imported,
you can see raw statistical data
calculated for the SLI as well as the SLI chart and SLI values distribution chart
displaying the value buckets that occurred across the defined data set.
The Reliability Burn Down chart is available only after successfully performed analysis.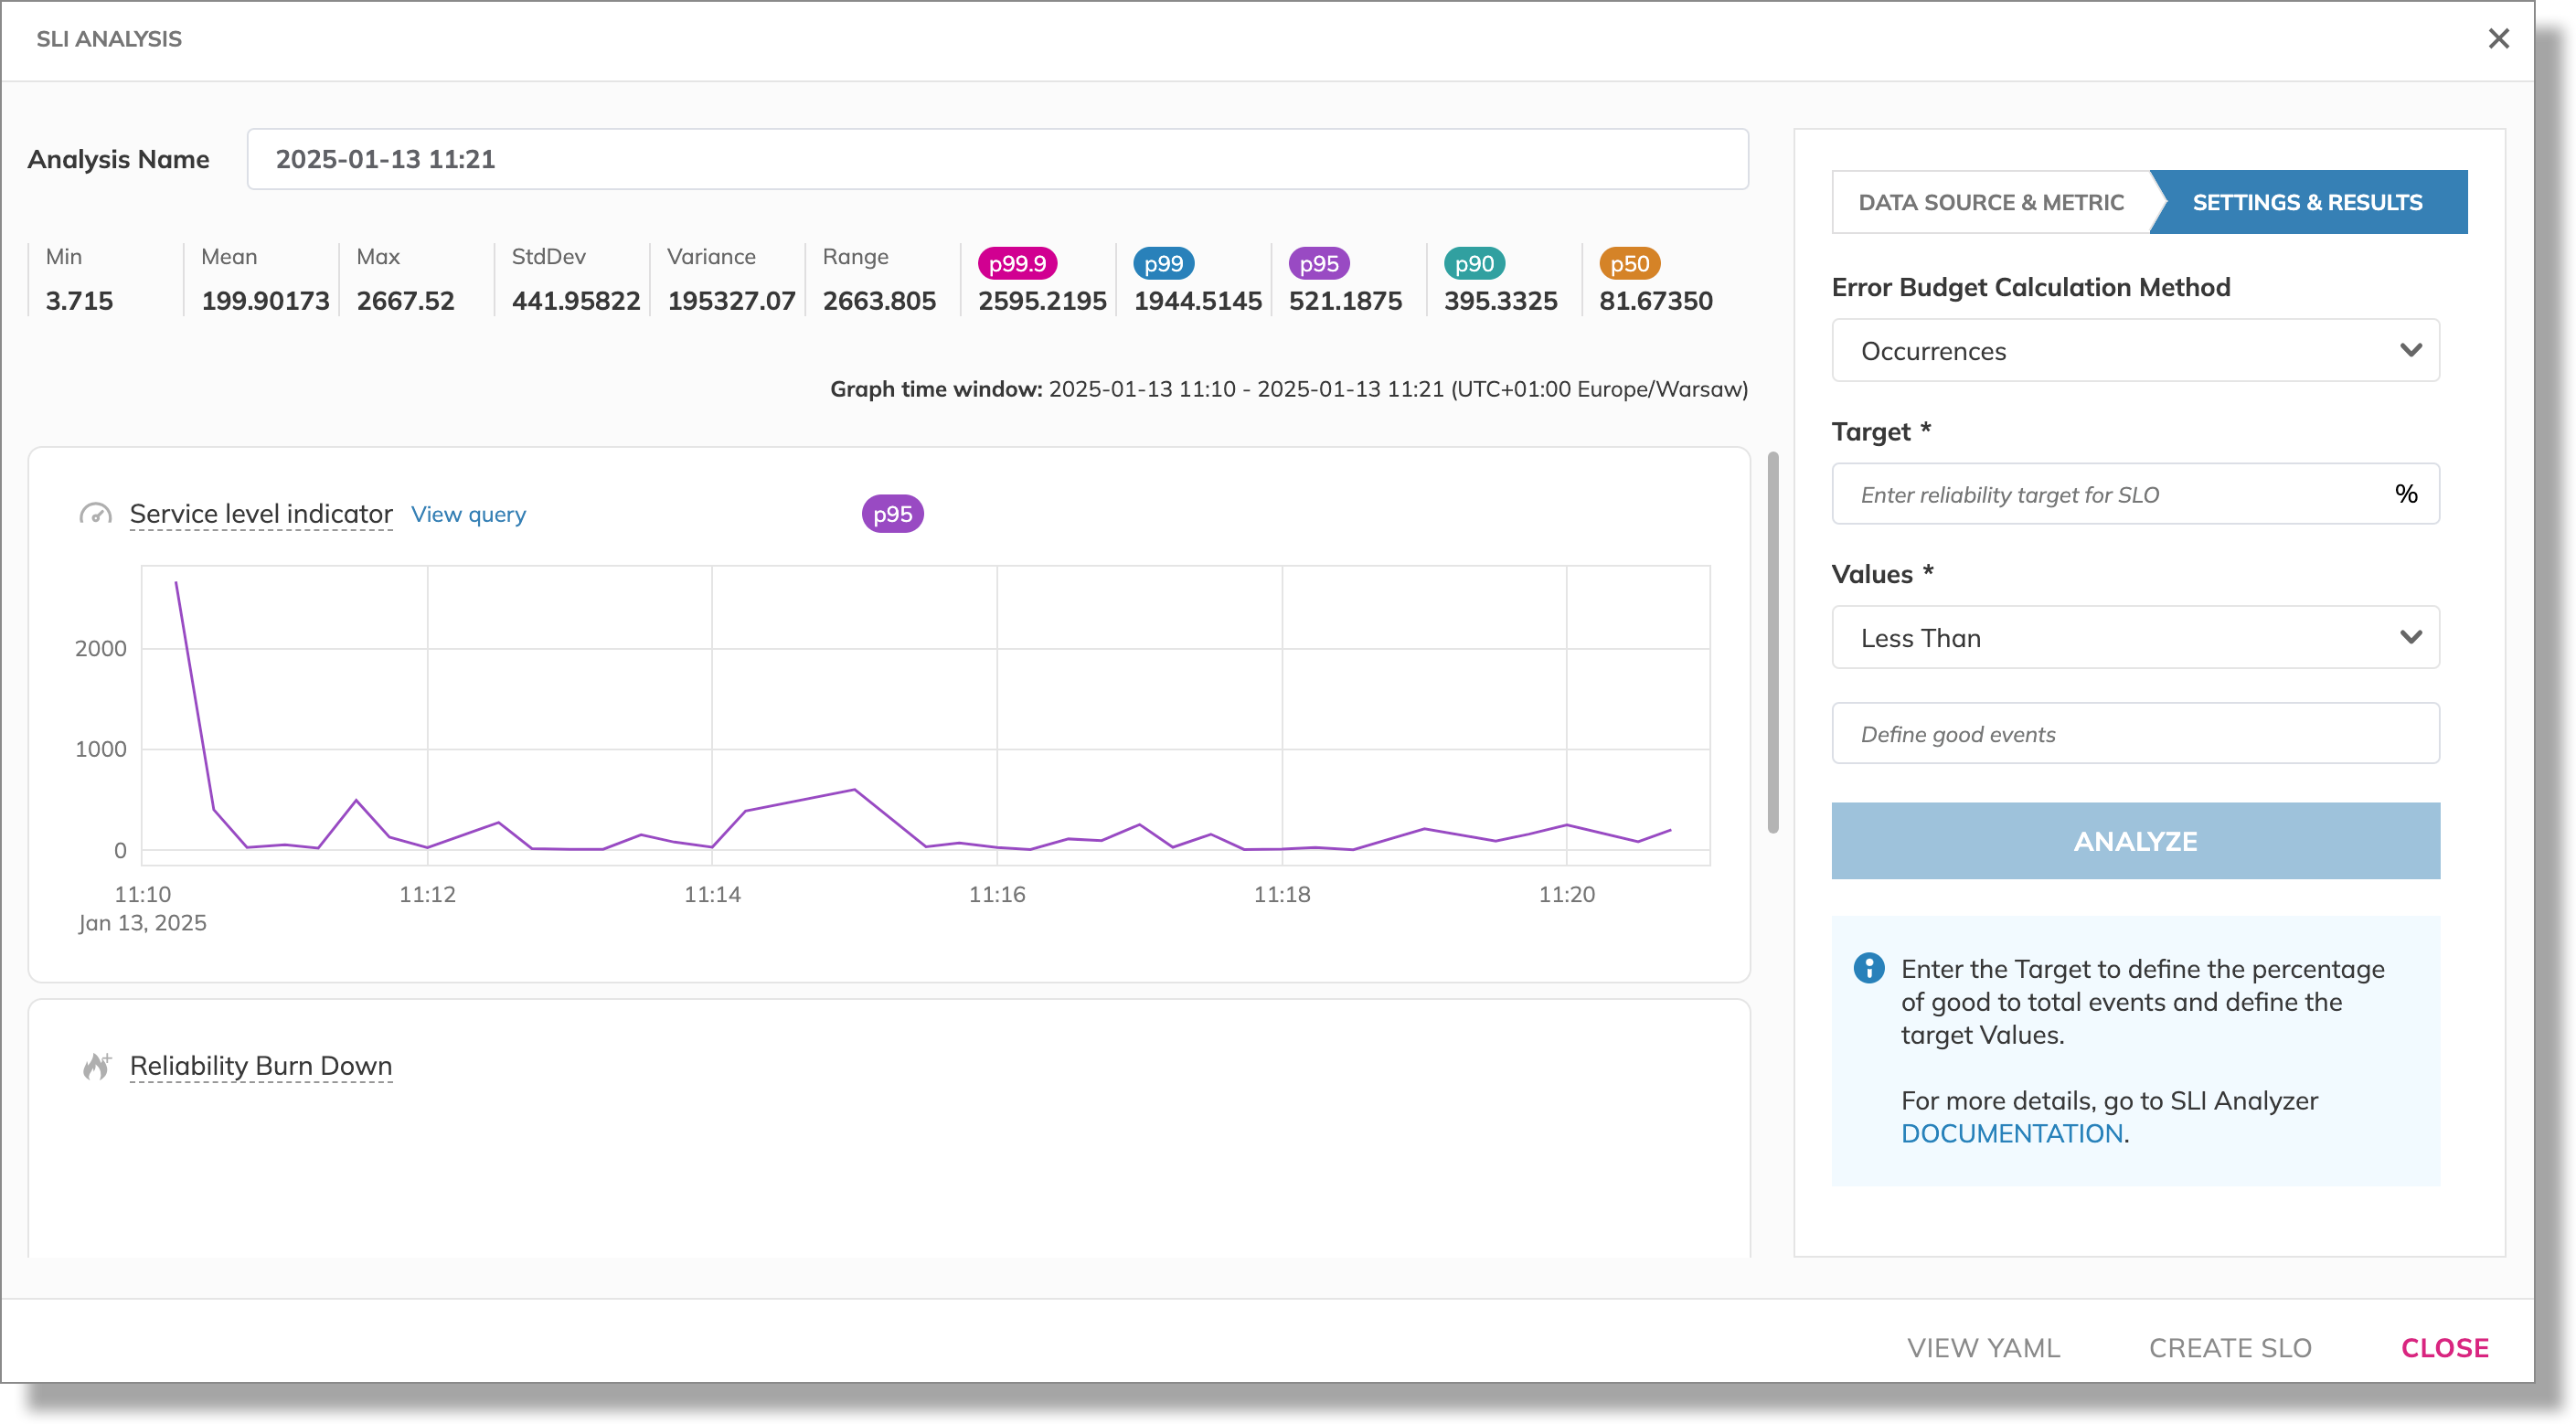
Learn more about data import in SLI analyzer.
When you have data imported, you can proceed with analysis. To do so, follow these steps:
- Open the analysis with the Import complete status.
- Select the Error budget calculation method and configure the targets:
- For Occurrences, set the reliability Target for your service level objective.s
- For Time slices, specify the Time slice allowance to determine good and bad time slices and the reliability Target for your service level objective.
- If you used a threshold metric to import data, configure Values.
Values relate to actual data points returned by your query, and you set what you consider a "good" data point—your data points objective. For example, it can be
greater than80—then, values above80are considered good, values80and below—bad. - Click Analyze to see how the imported data correlates with the error budget values you set.
Experiment with the budgeting method parameters to find the best fit for your needs—try different combinations and see how they affect the charts.
Learn more about data analysis in SLI Analyzer.