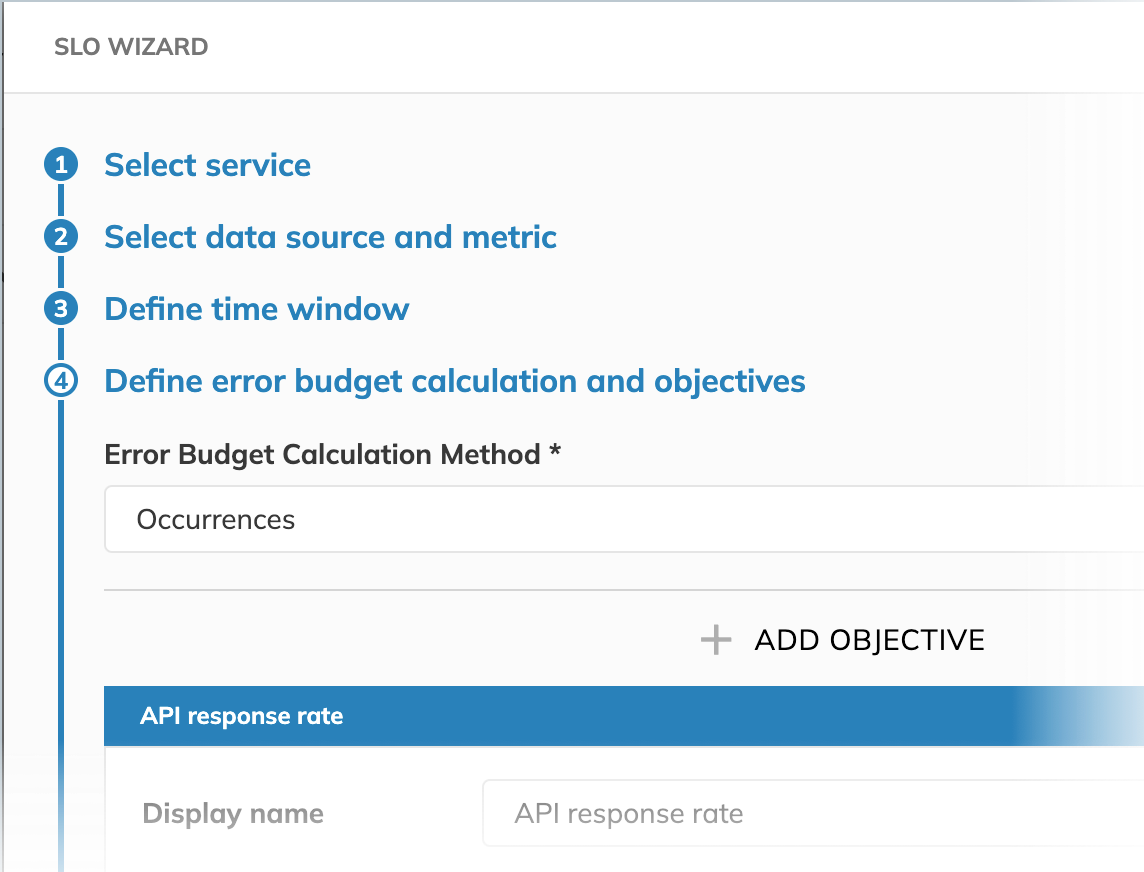
Occurrences error budget calculation method
The Occurrences method of error budget calculation compares the count of good events (for example, requests that fall within the defined boundaries) against the count of all events (i.e., all requests, including requests that perform outside the defined boundaries).
Unlike the Time slices budgeting method, Occurrences considers actual events instead of minutes.
In this budgeting method, the impact of each individual data point on the error budget is inversely proportional to the data point density (number of data points) within the time window. This means:
-
The more data points, the lower the impact of each data point
-
The fewer data points, the higher the impact of each data point
-
With more frequently occurring events, each individual failure has a smaller impact on the error budget
-
With more sparsely occurring events, each individual failure has a greater impact
To configure the Occurrences budgeting method, you specify your required target reliability in percent. For the threshold metric type, you additionally set the operator and values to reflect what you consider a good experience.
This article guides you through configuring the Occurrences budgeting method, illustrating the configuration with a practical example.
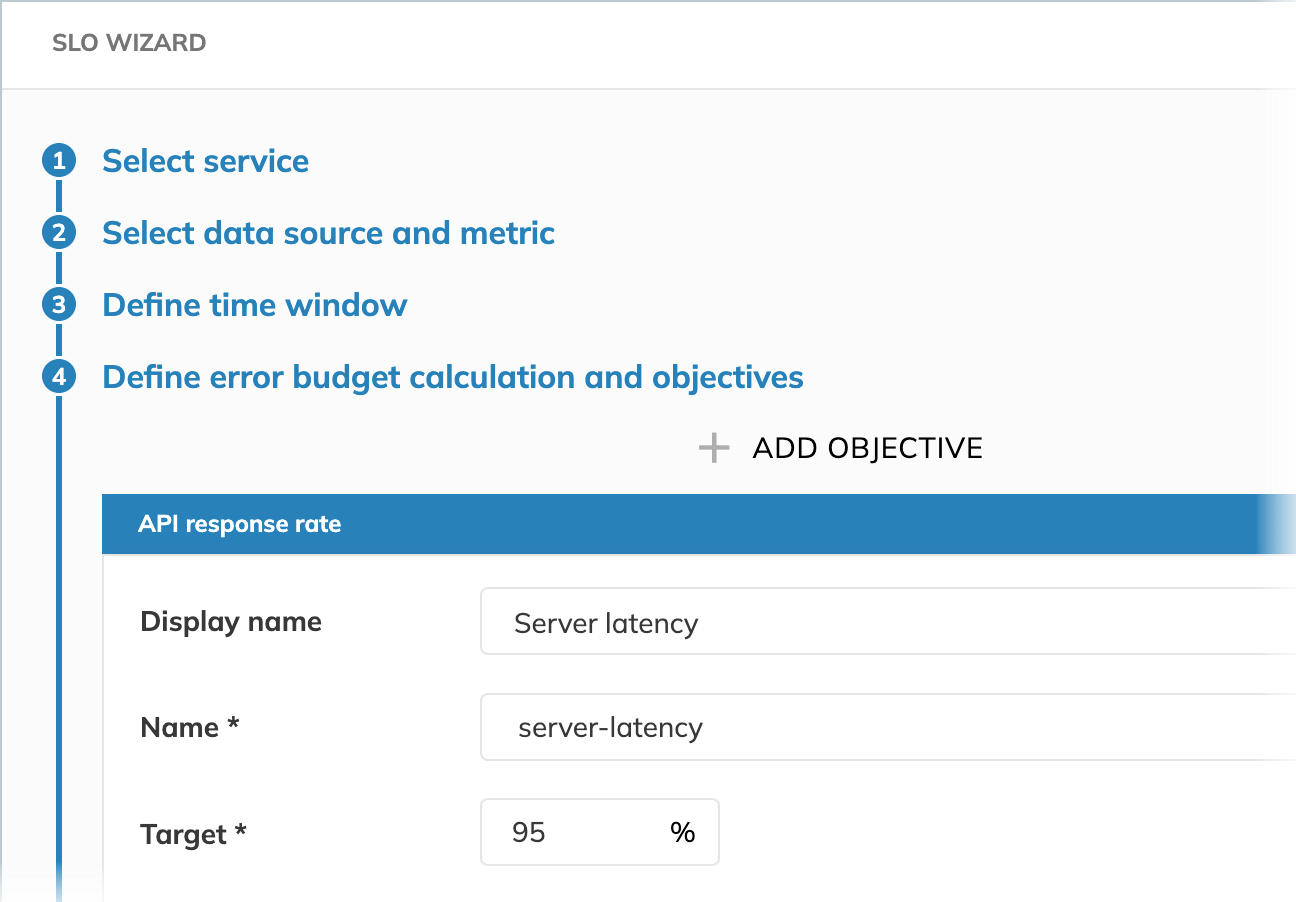
To consider the system reliable, server latency must remain below 200 milliseconds for at least 95% of events occurring within the SLO time window.
Target
Target is used to calculate the error budget. It also defines which failure rate is acceptable. For a 95% reliability target, we allow up to 5% of events to exceed the latency threshold within the time window.
In our example for the Occurrences budgeting method, it means that for 95% of events occurring within the SLO time window, our server must report latency SLI in the "good" range. Under this condition, we consider our system reliable.
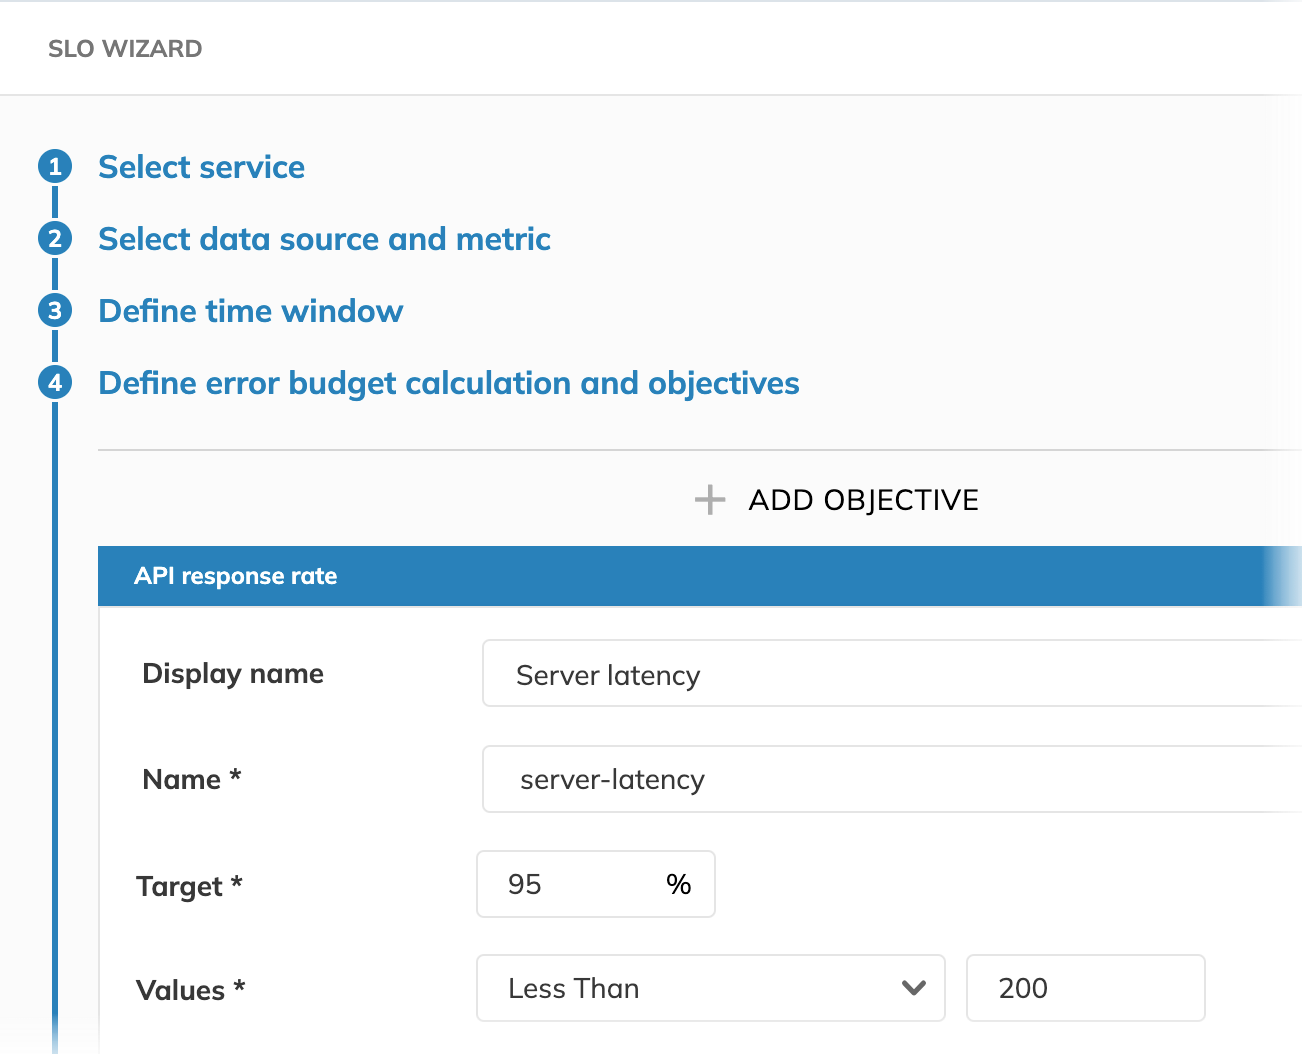
Values and operator
Values and operator apply to the threshold metric only.
In ratio metrics, the values field exists for the backward compatibility and must be unique,
but its specific value is not used in calculations.
Editing the value and op fields resets SLO calculations, and this also applies to the legacy value field in ratio metrics.
For this reason, avoid editing value in ratio metrics: changing it will only reset your SLO calculations.
Values refer to data points collected from your data source and, in combination with the operator, define the value range you're aiming your SLO objective at.
In other words, Values and Operator define what we consider "good" or "bad" for the SLO objective.
For instance, if Values less than 200 is the objective for a good experience,
data points with values below 200 will be considered good, while
values of 200 and higher will burn the SLO's error budget.
In our example, we query for our server latency in milliseconds.
We set values to <200, expecting the latency to be below this threshold.
Use case example
Let's consider our server latency, aligning with our example configuration goal:
- We aim for 95% of events occurring within the SLO time window to have the latency below 200 milliseconds
- So, our target is 95%
- We consider the server latency less than 200ms a "good event"
Why choose Occurrences for this scenario?
The Occurrences method is ideal here because it reflects the user experience based on the total percentage of fast versus slow responses.
It directly answers the question: "What percentage of total user interactions met our performance criteria?"
How would this differ with the Time slices method?
If we used the Time slices budgeting method for this goal, we might get a different perspective that doesn't align as well with our objective of "95% of all responses".
For example, with Time slices, we would define a "good minute" (e.g., a minute where 90% of requests are < 200ms) and then target a percentage of good minutes (e.g., 95% of minutes should be "good minutes"). Consider this:
- The service might have excellent performance (e.g., 99.9% of requests < 200ms) during peak hours, which constitute many "good minutes" and a very high number of "good events."
- However, during several off-peak minutes, the performance might dip (e.g., only 70% of requests < 200ms). These would be "bad minutes" according to Time slices.
- With enough of these "bad minutes," even if the actual number of slow requests during these off-peak times is small, SLO's error budget would be exhausted.
Conversely, the Occurrences SLO might still be healthy because the vast majority of total requests were fast.
Since our goal is strictly about the overall percentage of successful requests, Occurrences gives a more direct measure.

