Time slices error budget calculation method
The Time slices method of error budget calculation measures how many good minutes were achieved (minutes where a system is operating within defined boundaries) during a time window. Every time slice covers a 1-minute evaluation interval. A good minute is one where the time slice allowance is not violated.
Unlike the Occurrences budgeting method, in Time slices minutes within a time window are considered.
With this method, minutes with an unknown status (for example, future minutes in a calendar-aligned time window) are treated as good. For this reason, only bad minutes can influence the reliability and error budget of an SLO.
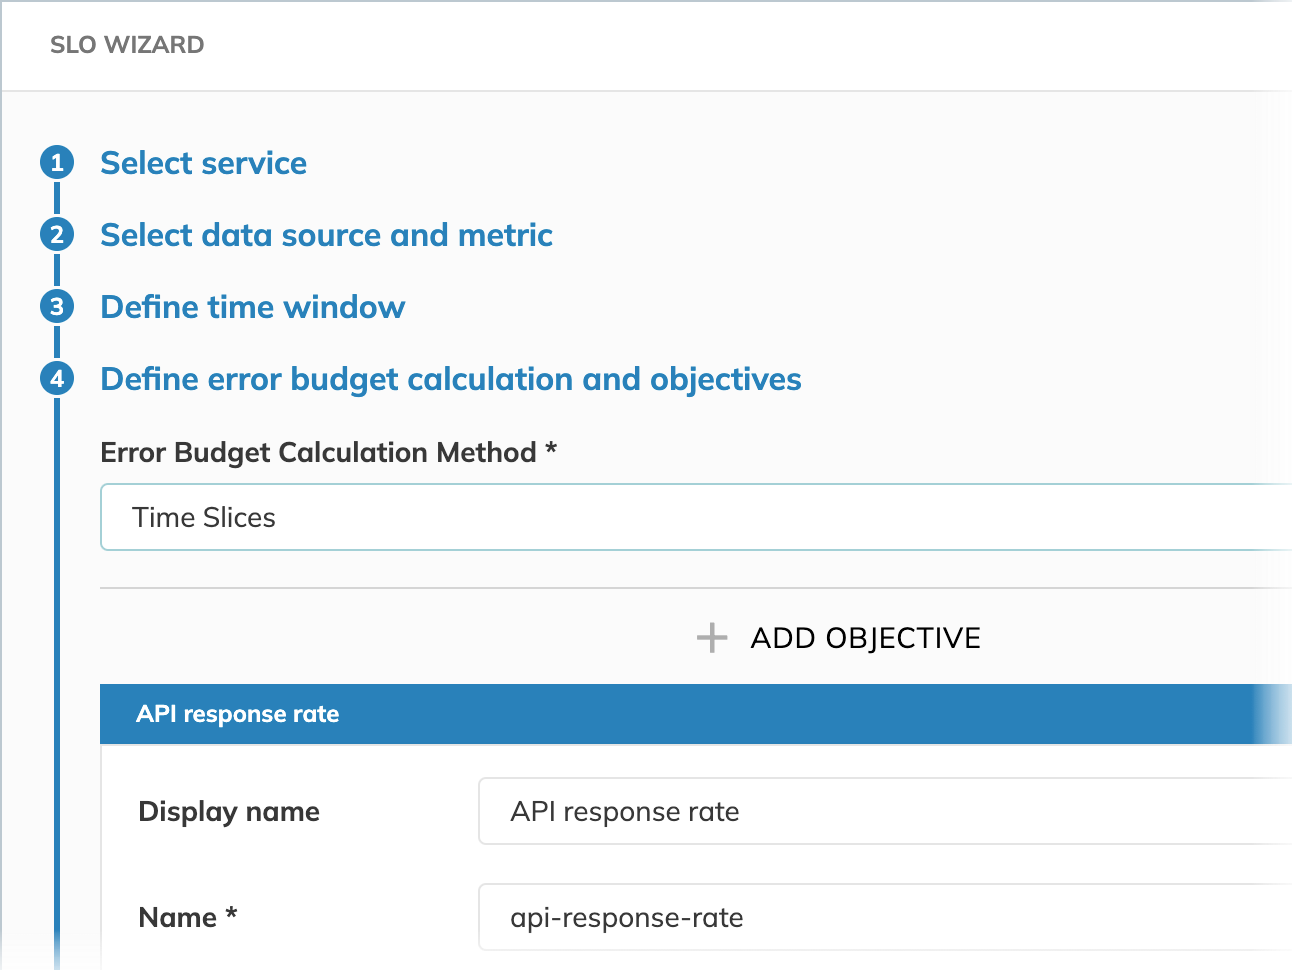
To configure the Time slices budgeting method, you specify your required target reliability in percent. Also, you set the time slice allowance and values to reflect what you consider a good minute.
This article guides you through configuring the Time Slices budgeting method, illustrating the configuration with a practical example.
We're tracking the application's server latency. Our goal is for the service to perform well 95% of the time within the time window, while considering it performs well if 90% of data points received within a minute indicate responses shorter than 200 milliseconds.
Target
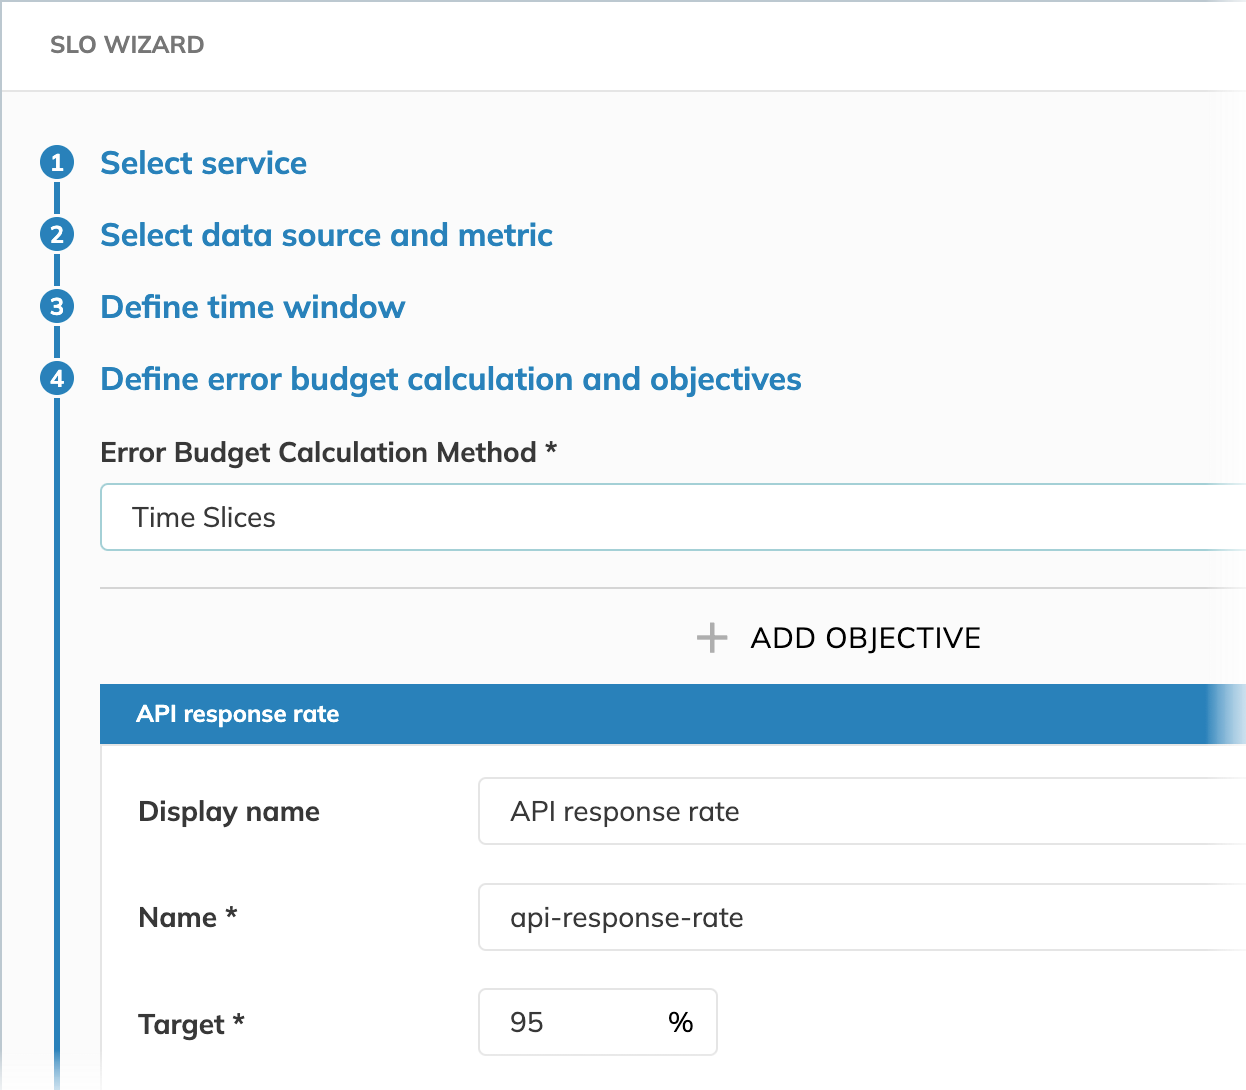
Target is used to calculate your error budget. If we aim for our application server to be reliable 95% of the time, we accept a maximum failure rate of 5% over the defined time window. For this reason, we set the SLO reliability target to 95%.
For the Time slices budgeting method, the target defines the percentage of good minutes over the entire time window. In our example, it means that the application server must be available 95% of the time.
Time slice allowance
Time slice allowance defines the criteria for a "good minute" by specifying the acceptable range for data points within every minute.
Each time slice (minute) is evaluated independently to determine whether it fell within the defined allowance.
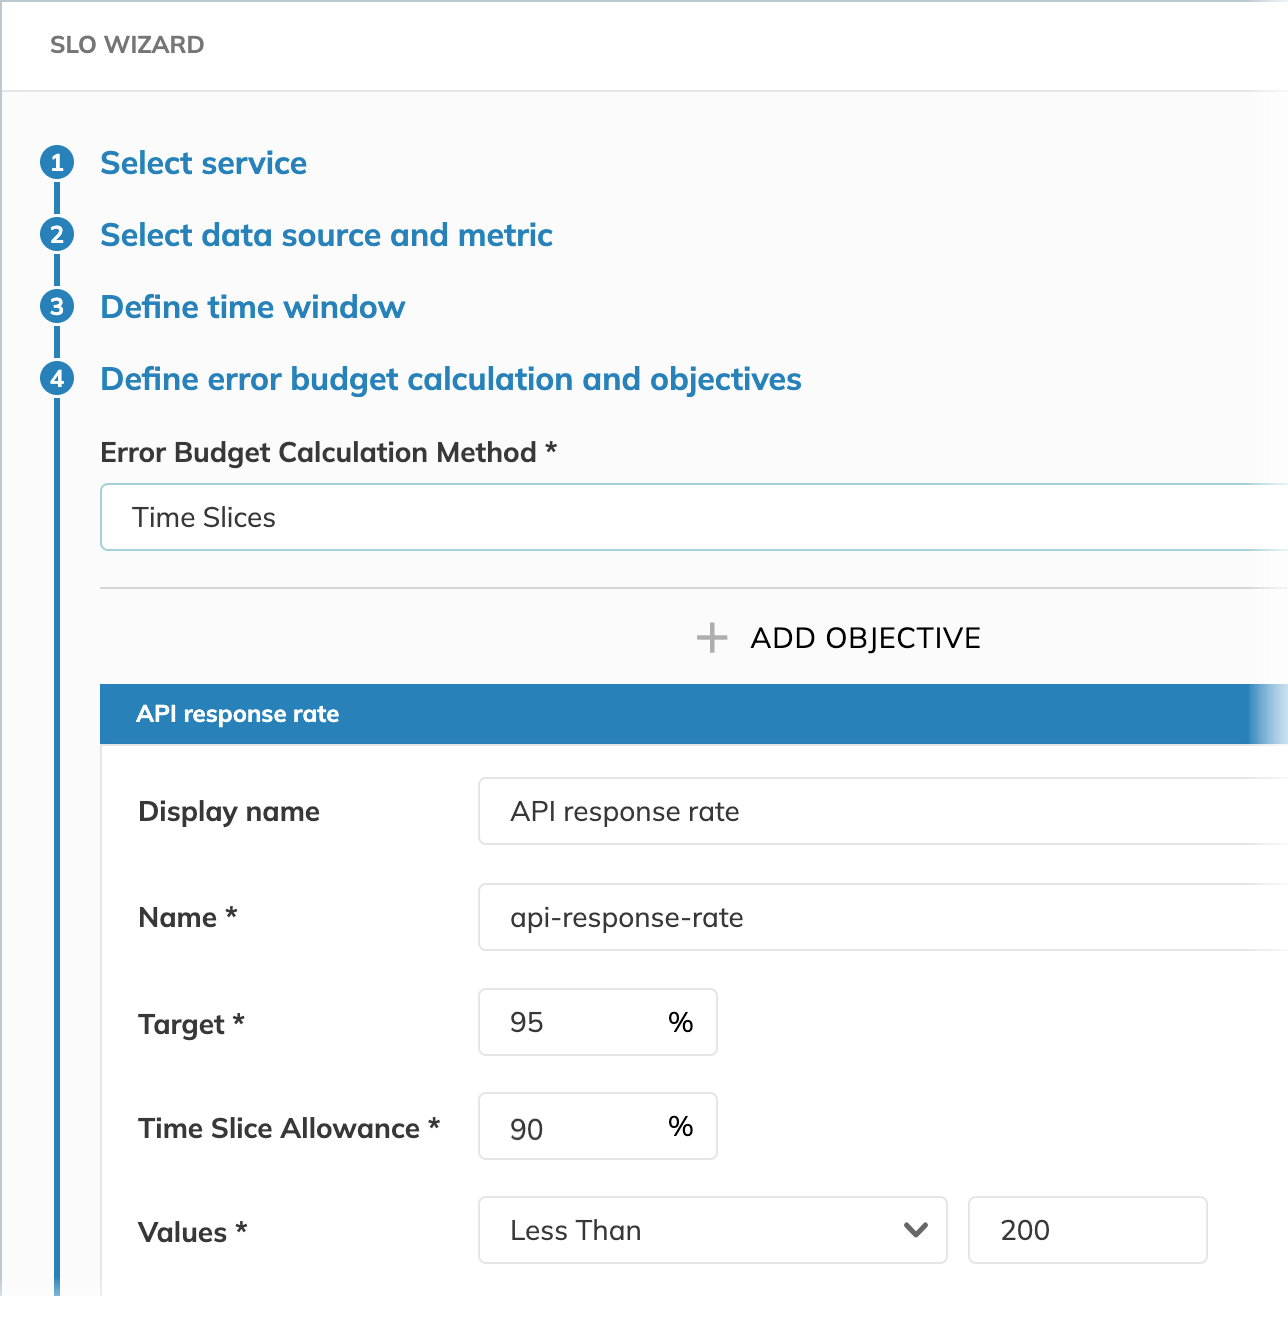
For example, if Time slice allowance 90% and Values less than 200 is the objective for a good minute,
we tolerate if our SLO reports values 200 or greater for 6 seconds within every minute.
Any excess of this percentage would burn the error budget.
In our example, we query for the server latency in milliseconds. Time slice allowance 90% and values less than 200 mean that we consider a good minute if our server's latency is below 200 milliseconds for 54 seconds per minute.
Use case example
Let's consider our application's API server latency, aligning with our example configuration goal:
- Our overall reliability Target is for the server to be available and performant for 95% of the minutes within our monitoring time window
- A single minute is considered "good" if at least 90% of the API responses processed within that minute are complete in under 200 milliseconds. This defines our Time slice allowance and the values for a good minute.
Why choose Time slices for this scenario?
The Time slices method is ideal when the objective emphasizes consistent performance over time, measured in discrete intervals (typically per-minute).
This approach ensures that the desired user experience is met for most intervals, and any intervals failing to meet the criteria contribute to burning the error budget.
Each 1-minute time slice is evaluated independently, and its contribution to the error budget is normalized over time based on the target. For example, if the target is very strict and the error budget is small, even slight degradation in performance within a single bad minute can burn a significant portion of the error budget.
This means the total number of requests in the bad minute doesn't matter—what matters is the fraction of "bad minutes" relative to the total. As a result, this method captures the impact of sustained periods of slightly degraded performance evenly, regardless of request volume during those intervals.
How would this differ with the Occurrences method?
If we used the Occurrences budgeting method with an overall target (e.g., 99.5% of all requests must be < 200ms), we might overlook scenarios where the service is consistently poor for a subset of time, especially if that coincides with lower traffic. For instance:
- Imagine periods of very high traffic where nearly 100% of requests are < 200ms. These contribute to a large number of "good events".
- Then, during several consecutive off-peak minutes, perhaps only 70% of requests meet the < 200ms criteria. While each of these minutes is "bad" by our per-minute standard, the total number of slow requests might be small compared to the good requests from peak times.
With Occurrences, the SLO might still appear healthy due to the high volume of good events from peak periods masking the consistent poor performance during those off-peak minutes.
However, with Time slices, each of those off-peak minutes where only, say, 70% of requests were fast (failing our 90% per-minute allowance) would be flagged as a "bad minute". If enough such "bad minutes" accumulate, our 95% target for "good minutes" over the time window would be breached. This correctly alerts us to an issue with sustained service quality that the Occurrences method might miss if purely looking at the aggregate event counts.
Therefore, when your objective is to ensure that specific performance criteria are met for a defined percentage of discrete time intervals (like minutes), the Time slices method provides a more accurate measure of sustained service reliability.
For the impact of the time slices calculation method for sparse metrics, see the SLO calculations guide.

