Alerting center
The Alerting center is designed to manage site reliability and respond to production issues efficiently. It provides a centralized dashboard with a heat-mapped timeline of all past and active alerts related to SLOs.
With the Alerting center, you get:
Overview
To access the Alerting center, select Alerts in the main navigation panel.
Alerting center and RBAC
The Alerting center displays all alerts for SLOs in projects where you have at least view permission. Learn more about access management in Nobl9.
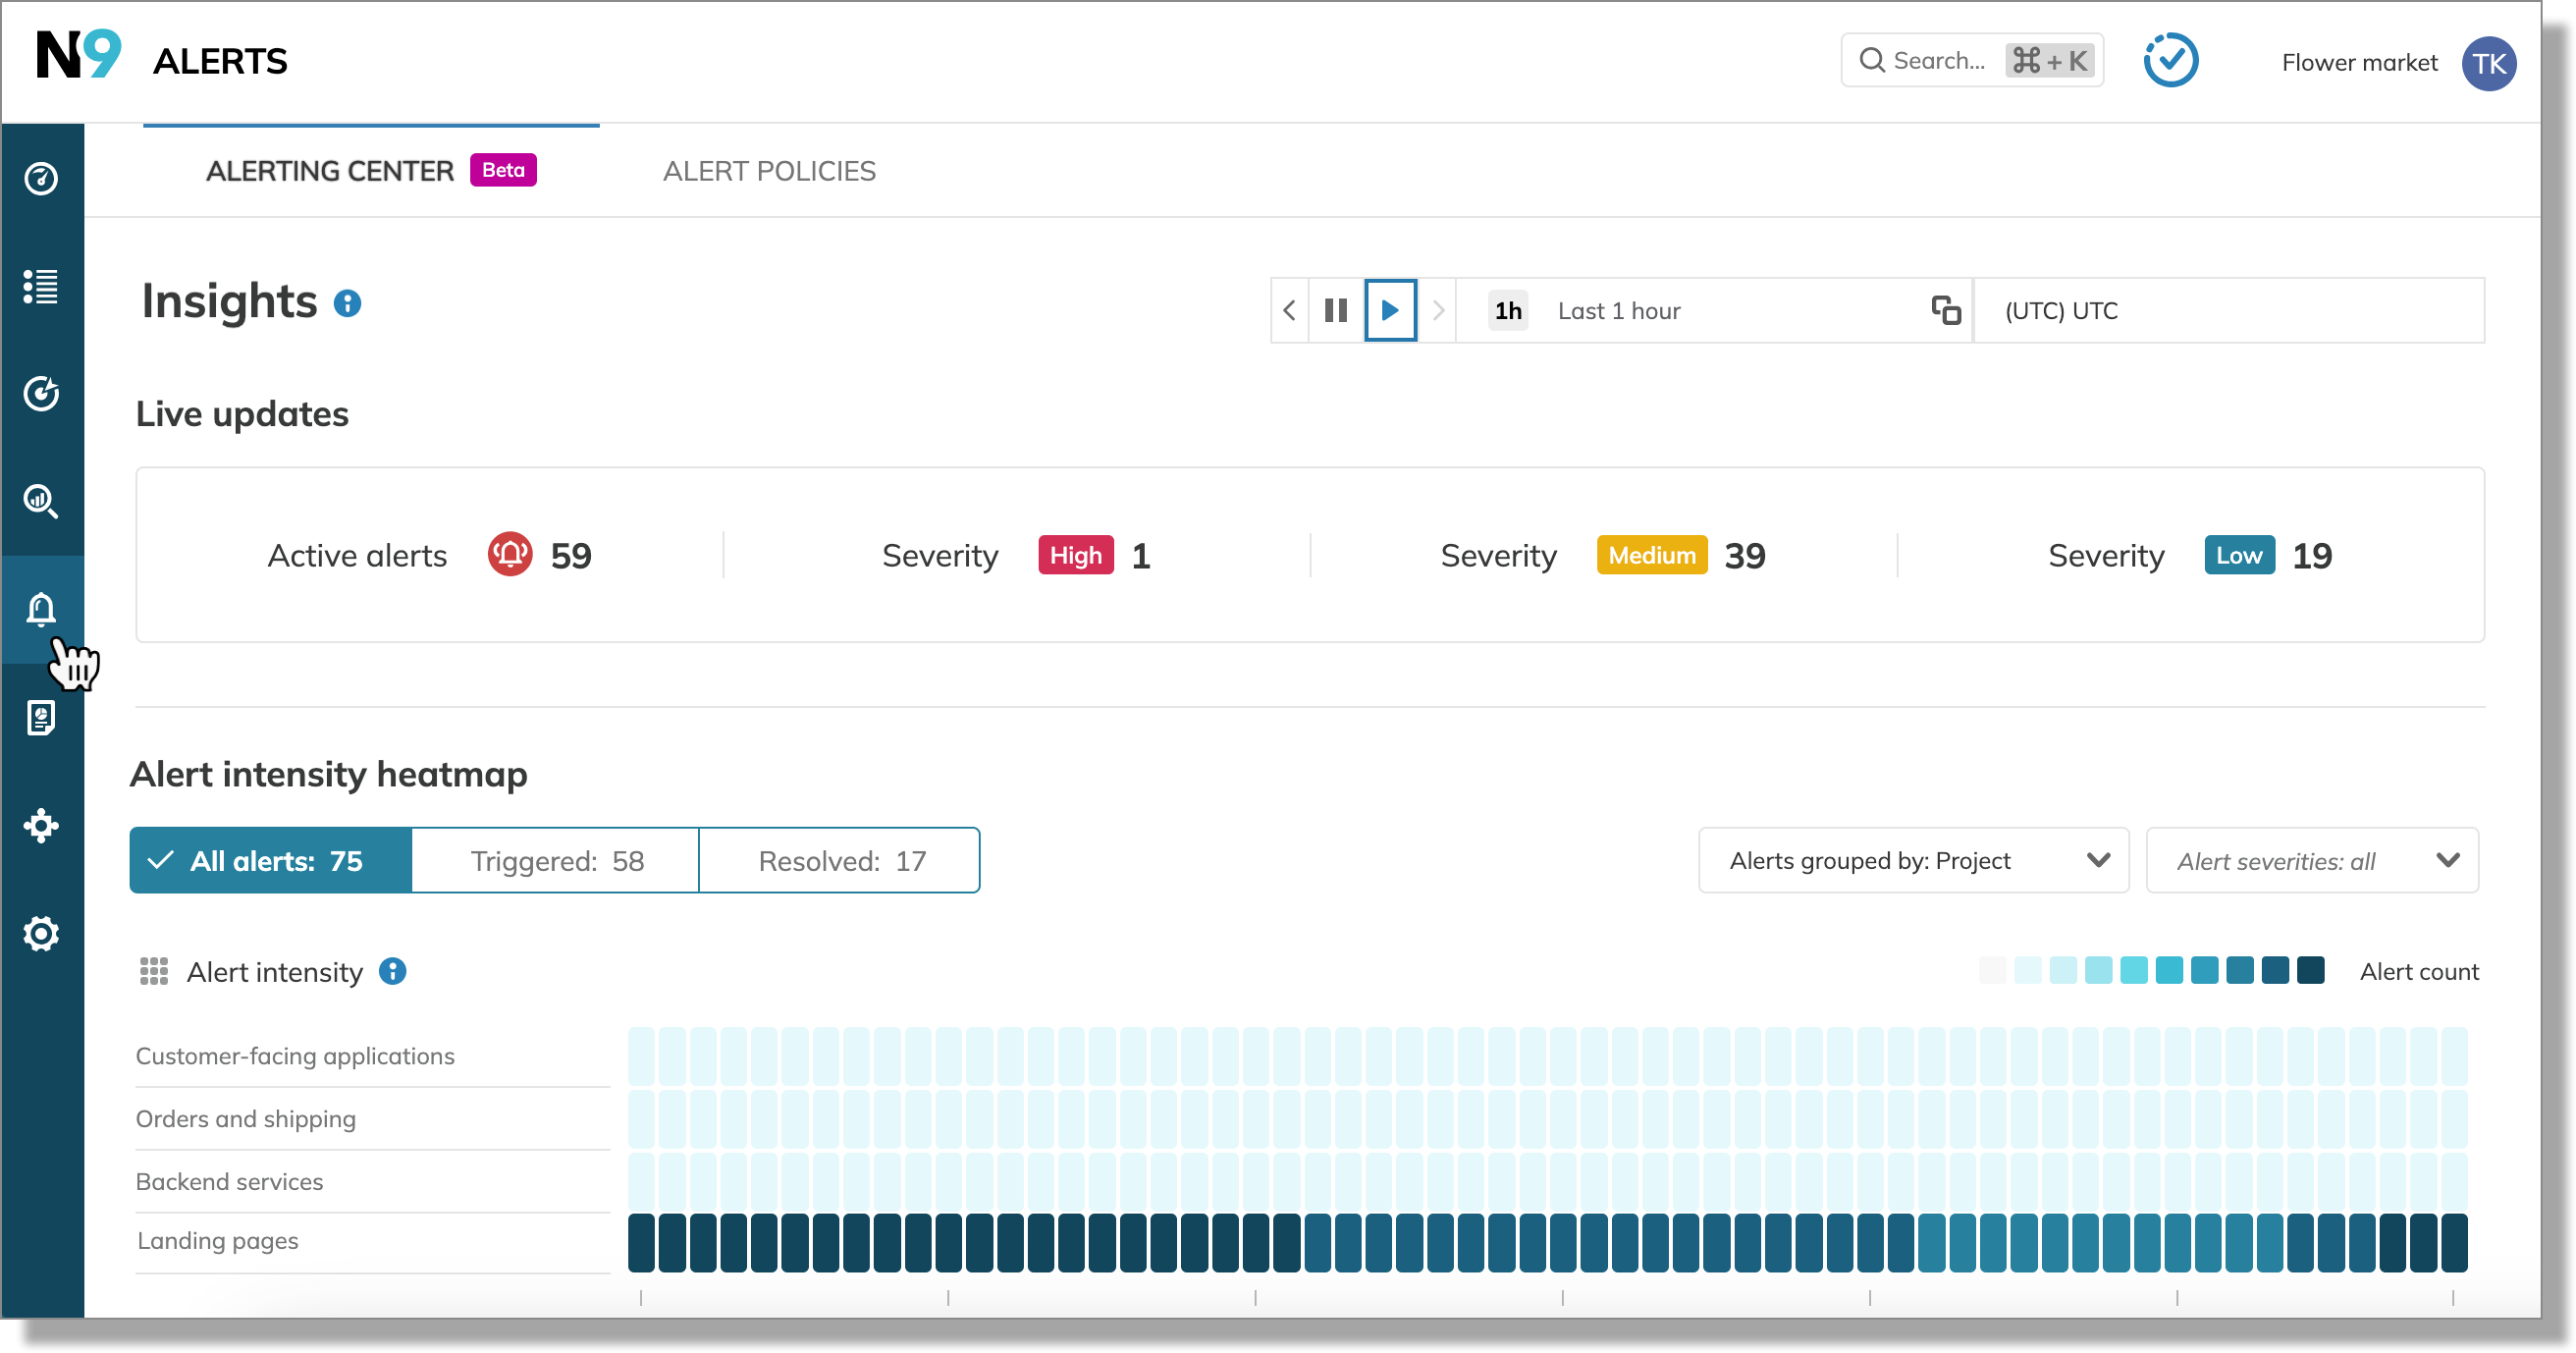
Heatmap
Heatmap displays alert intensity by resource—the darker the bucket color, the more alerts in this bucket.
The heatmap defaults to displaying:
- Alerts fired during the last 24 hours
- Triggered and resolved alerts
- Alerts grouped by project
- Resources sorted alphabetically
- Alerts of all severities
The heatmap aggregates alerts into 60 buckets, each representing a specific time interval. The duration of each bucket interval depends on the selected time window—it's calculated by dividing the time window into 60 equal parts.
For reference, the following table shows how the bucket interval changes based on the selected time window:
| Time window duration | Bucket interval |
|---|---|
| 1 hour | 60 seconds |
| 24 hours | 24 minutes |
| 1 week | 168 minutes |
Alerts can be filtered by status: triggered, resolved and severity: low, medium, high and grouped by resource: project, service, alert policy, and SLO.
Clicking a colored bucket on the heatmap displays the list of affected SLOs. Click the required SLO link to open the Alerts tab of this SLO details.
Limitations
The Alerting center has the following limitations:
- The heatmap displays the most recent 20000 alerts within your organization.
- If you apply severity filters on the heatmap and then, from the Alerting SLOs list, open any SLO details > Alerts tab; the alerts won't be filtered by severity under the Alerts tab.
Example use cases
- Critical event monitoring
- Identifying a bottleneck in a microservice architecture
During a flash sale on Flower Market's eCommerce site, an unexpected surge in traffic triggered numerous alerts. The SRE team used the Alerting center to quickly identify the root cause of the performance issues impacting the customer experience and sales.
They selected a 4-hour time window to focus on alerts directly related to the recent traffic spike.
A quick check of the Live updates section showed multiple active alerts across different site areas. To isolate the problem, the team grouped the alerts by service, suspecting backend scaling issues.
To prioritize their investigation, they applied the following filters:
- Severity: High
- Status: Triggered
This immediately highlighted which services were struggling under the increased load and allowed the team to rapidly pinpoint the affected services and begin troubleshooting the most critical problems. Further investigation would then be needed to get to the root cause of these high severity alerts.
The Flower Market recently migrated to a microservice architecture, introducing a new Order processing service. After a week of live operation, they experience an unexpected increase in customer complaints regarding slow order processing.
Using the Alerting center, the SRE team aims to pinpoint the root cause of the performance degradation.
The team selects Service as the grouping method for the heatmap. This organizes alerts based on which microservice triggered them. They select a 1-week time window and apply the following filters:
- Severity: High and Medium
- Status: Triggered
The heatmap, now filtered to only show unresolved alerts with medium and high severity, reveals a significantly higher intensity of alerts in the Order processing service, indicated by a dark bucket in the heatmap. The team accesses a list of specific SLOs that triggered alerts during the monitored period. This list further helps to pinpoint the specific parts of the order processing functionality that were struggling.
Alert investigation revealed that a critical database request within the Order processing service was extremely slow for a 24-hour period, causing the performance problems customers reported. This bottleneck was the cause of the slowdowns reported by customers. After optimization, the subsequent week's heatmap with the same filter settings showcases a significant reduction in alerts, confirming the resolution and demonstrating the service's improved reliability.