Nobl9 Application (1.53)
- Alert list in the SLO details
- Alert indicators in the SLO grid view
- Alert indicators on the Service health dashboard
- Possibility to view and export raw SLI data in the SLO details
- Account details screen was extended with project role assignment information
- Query checker (Beta) was extended with buttons to edit SLO or its data source
- We’ve fixed a problem with Replay getting stuck after importing the historical data.
Release details
new Alert list in the SLO details
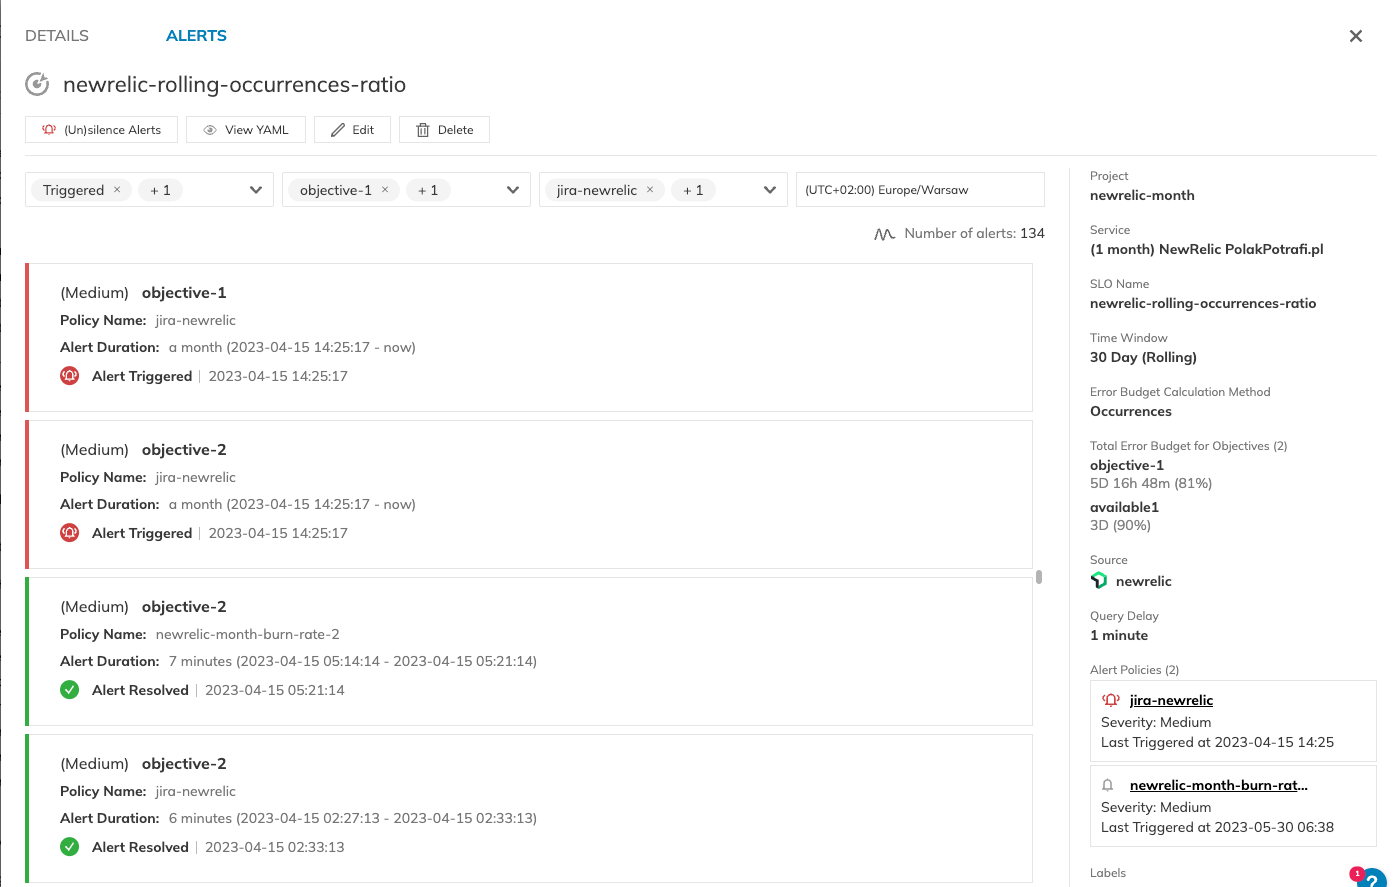
The SLO details screen now includes a new tab called Alerts where you can preview the alert list.
This list provides information on all the alerts that have been triggered for your SLO. You can easily determine whether an alert has been resolved or is still active.
Additionally, you can view the duration for which it has been active, the associated alert policy, and which conditions of an SLO Objective it has met.
The alert list allows you to review up to 1000 alerts at once and provides filtering options to help you find the specific alert you're looking for.
You can also retrieve triggered alerts using the new sloctl get alerts command.
new Alert indicators in the SLO grid view
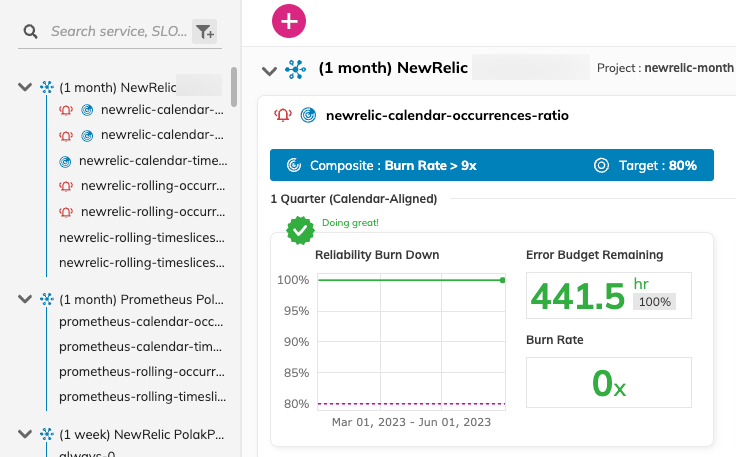
We've introduced a new feature called the Alert indicators in our SLO grid view.
The indicator shows up next to SLOs that currently have an active alert and allows you to quickly identify which SLOs might need your attention. It also indicates which objective of the SLO is currently alerting.
The indicator is visible in the Service/SLO tree and in the tiles of SLOs with triggered alerts.
new Alert indicators on the Service health dashboard
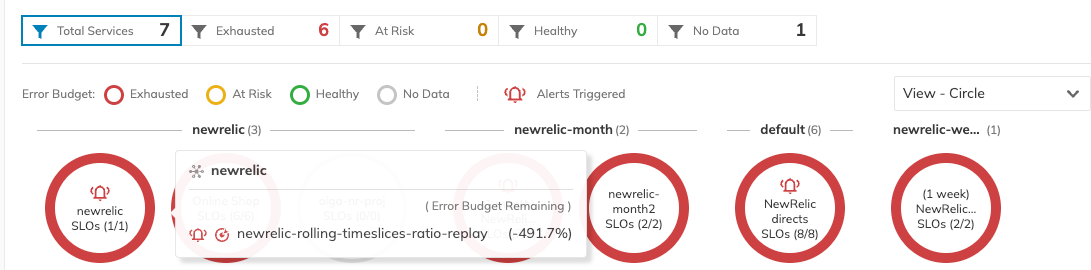
We’ve also added the alert indicators to the Service health dashboard.
The indicator is displayed on the service tiles services that have at least one SLO with a triggered alert.
You can also click the service tile to review the list of its SLOs and identify which SLO is the cause of the alert.
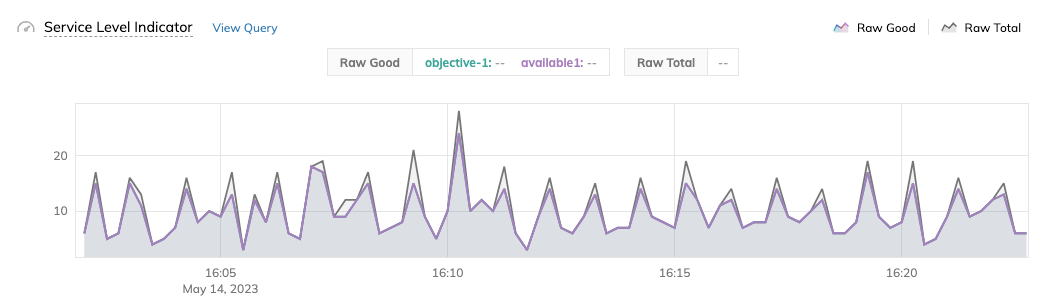
new Raw SLI Data in the SLO details
When investigating the cause of a burning or unstable SLO, it's crucial to rely on correct input information.
Nobl9 allows you to review the input raw SLI data used to calculate SLOs in a line chart. Because SLOs are typically created to cover an extended period, such as a month, the data presented on a month-long graph must be downsampled. That’s not ideal when investigating a specific occurrence of a budget burn or a spike in the SLI.
To help you in such cases, we’ve introduced the option to view the raw SLI data that is used for our SLO calculations and export it to a CSV file for a more thorough investigation.
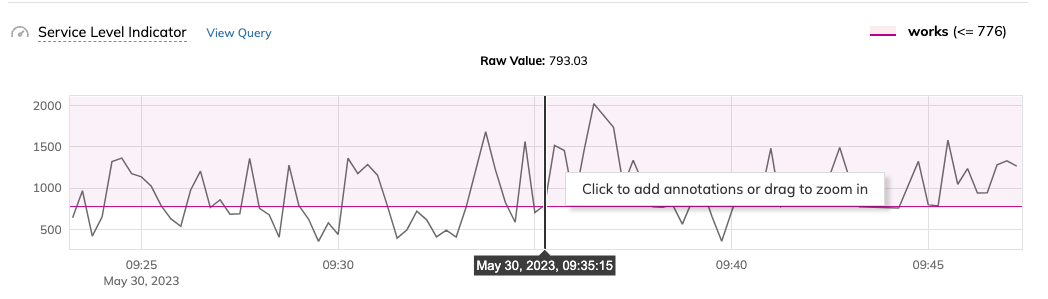
To see raw data, zoom the graphs in to display a 1-hour-long (or less) time window. When you do that, the calculated percentile values (for Threshold metrics) become raw values, and the summed-up Ratio metrics (Good/Bad and Total counts) become raw counts of values received by Nobl9 from your data source.
The Export Raw Data feature only becomes active when you're zooming into a 1-hour-long time window or into a smaller time window
Hitting the Export Raw Data button triggers a CSV file download that includes the raw SLI data points for all your SLO Objectives.
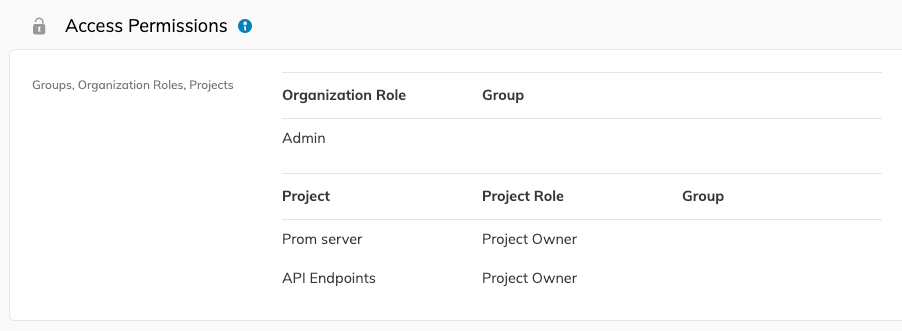
improved Project Role Assignment in the Account details
You can now quickly identify your roles and project assignments in your Access Permissions located in the Account screen that you can access from Settings.
improved Edit SLO and data source from Query Checker
The recently introduced Query checker (available in the Beta) has been equipped with the option to quickly navigate and edit the SLO Query or your data source settings.
This allows you to quickly take actions and correct any possible mistakes that stopped your SLO from gathering data.

improved Extended Support for Event Logs
We've extended the Event Logs feature to include all data sources supported by Nobl9, except Splunk Observability.
Thanks to Event Logs, you can access and review the log information generated for your SLOs that have been configured with the direct connection methods.
fixed Replay Runs Failing to Complete
Some customers reported that sometimes their SLOs running Replay get stuck and fail to complete.
After investigating the issue, we found the problem and implemented a fix that should prevent this from happening.