Data source event logs
Event logs allow access and review log information generated for your SLOs, SLOs with Replay, and SLI Analyzer.
Event logs are supported for data sources connected using the direct method, except for the Splunk Observability data source.
To use event logs, activate them for the required data source on the Nobl9 Web or using sloctl.
Event logs cover requests sent to a data source for the following query sources:
- SLO live processing
- Historical data retrieval—SLI Analyzer and Replay
Log emission frequency depends on the log level and query source. Nobl9 provides three log levels: Info, Warning, and Error.
| Log level | Categorization criteria | Emission frequency for SLO live processing, sampled | Emission frequency for historical data retrieval, raw |
|---|---|---|---|
| A request includes at least one non-zero result | Every 30 minutes | Every query | |
| A request returns zero results for all queries | Every 30 minutes | Every query | |
| A request resulted in error1 | Every 15 minutes | Every query |
1A response is considered correct when it returns one data point per timestamp. For single-query ratio metrics, two data points per timestamp is also an expected response.
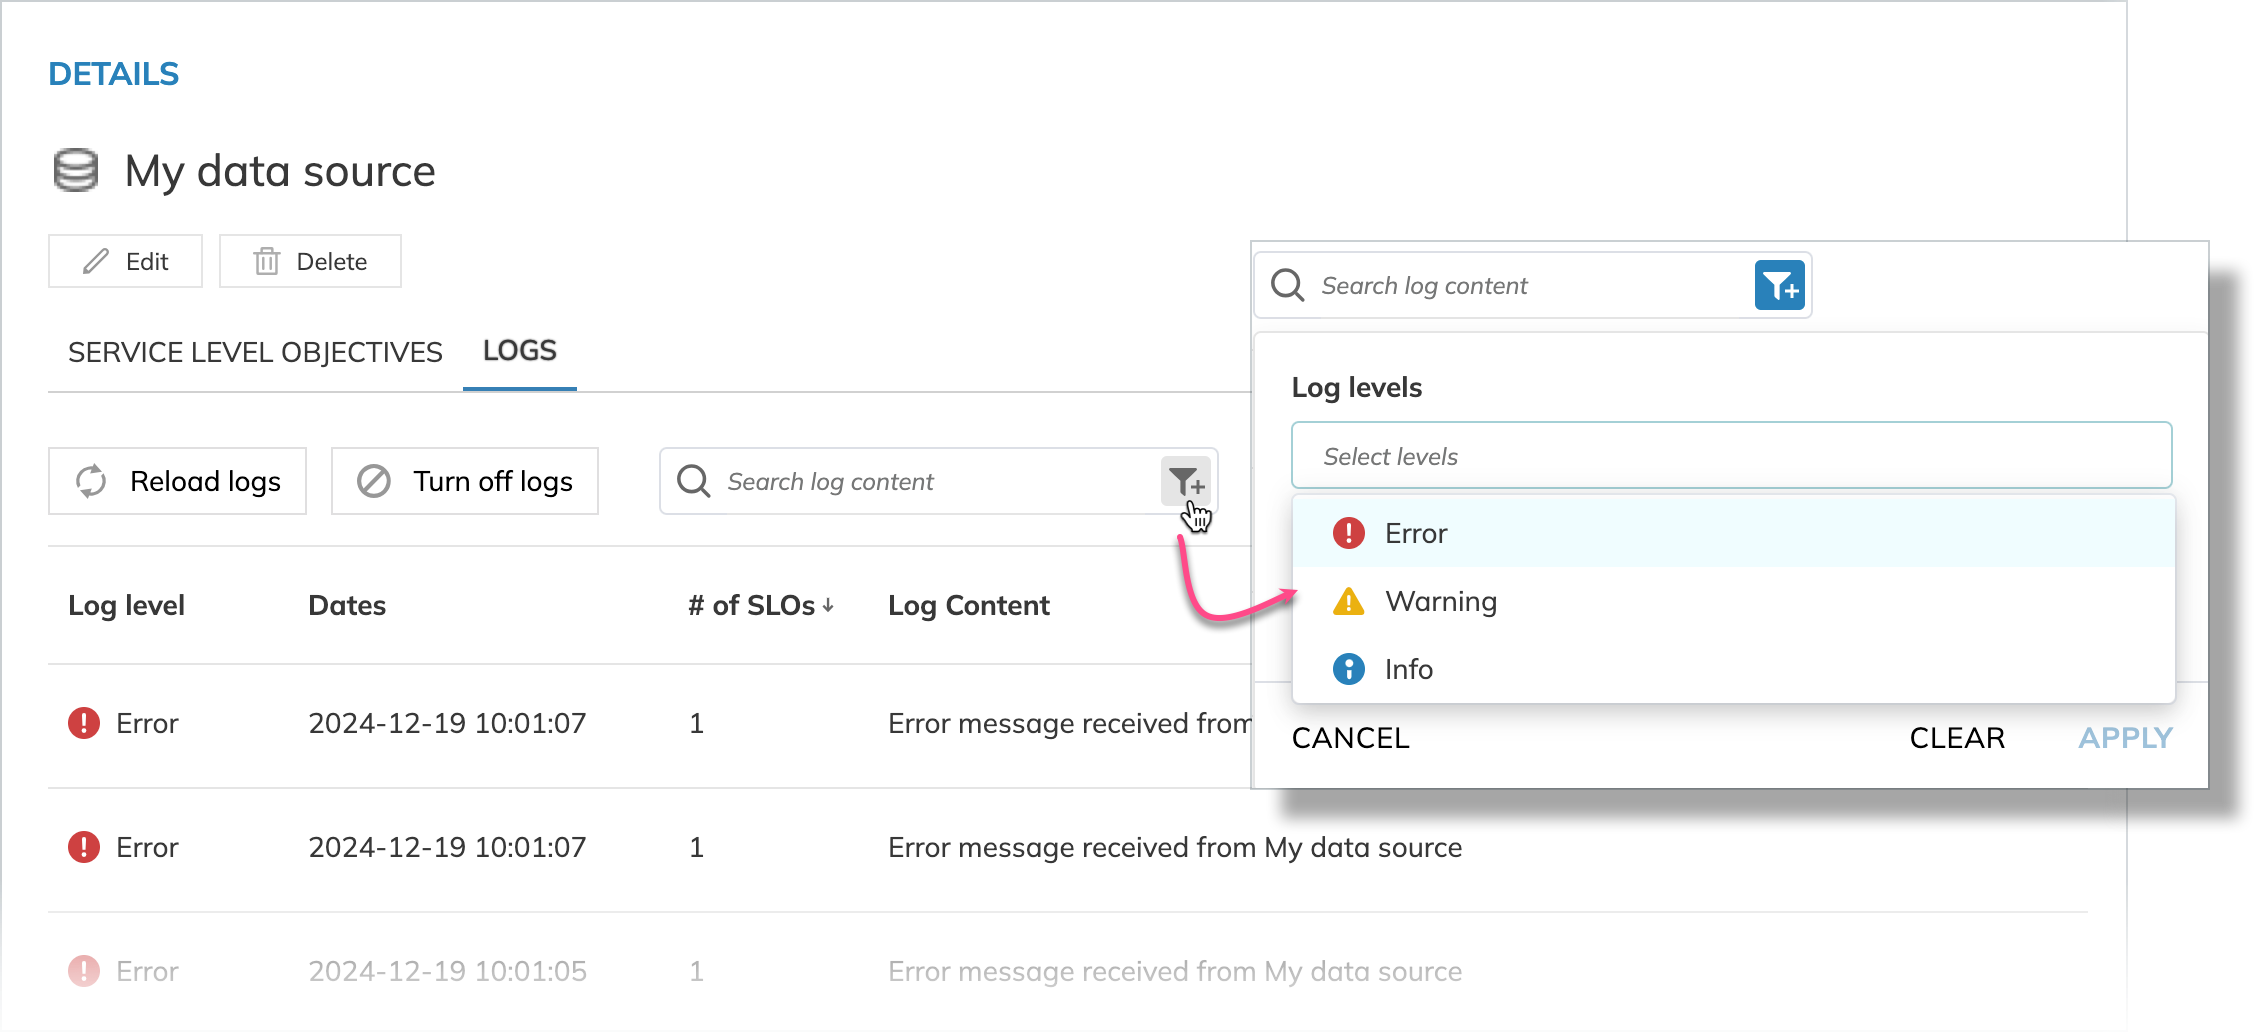
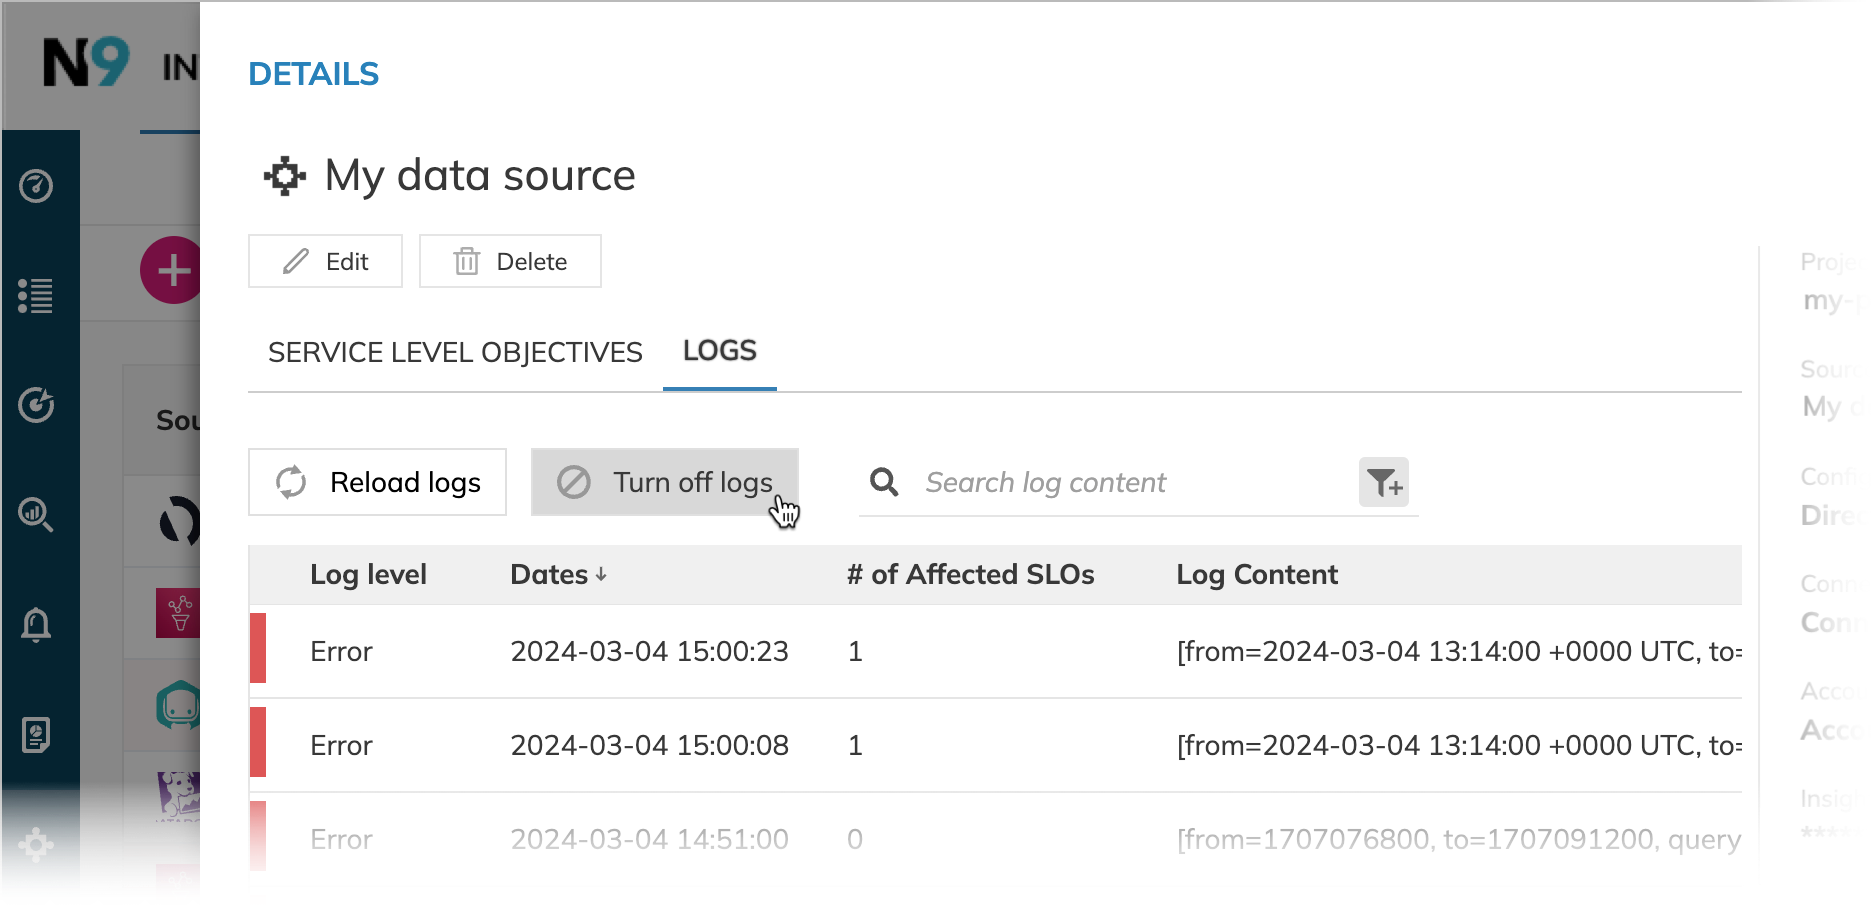
To access event logs, open the Logs tab on your required data source details. The list displays the following:
- The log level
- Date of the log emission
- The number of SLOs related to the log
- Log content with the detailed information about each log
You can filter event logs by the log level and SLO display name.
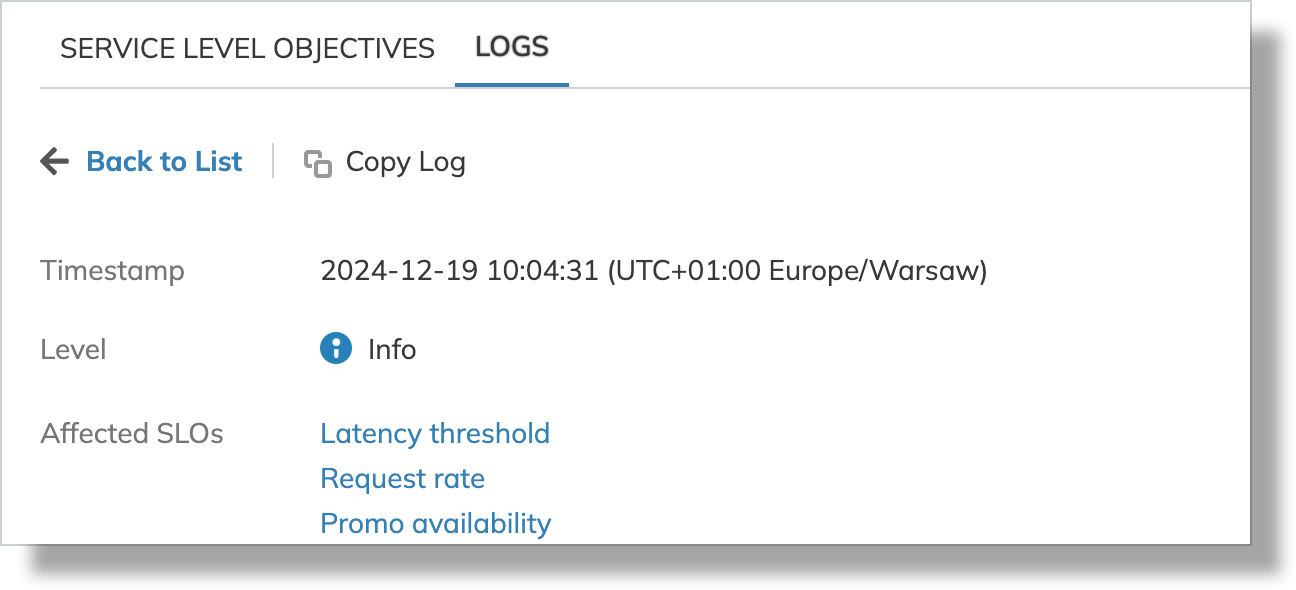
Click the required log entry to view the detailed information. Here, you find the log's timestamp, level, and the list of SLOs this log relates to:
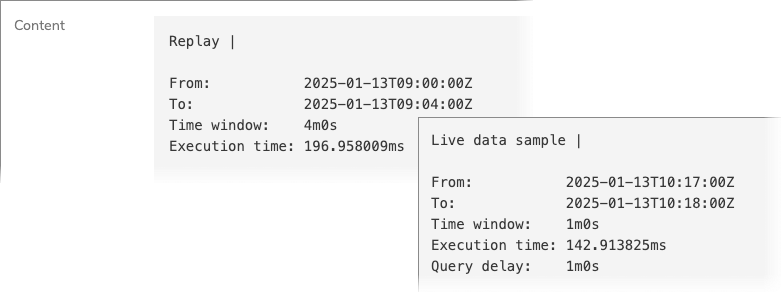
The Content section includes the request details:
| Field | Description | Query source |
|---|---|---|
| From and To | The requested time range | SLO processing, Historical data retrieval |
| Time window | The requested interval | SLO processing, Historical data retrieval |
| Execution time | How long did it take to execute the query | SLO processing, Historical data retrieval |
| Query delay | The query delay duration set for the data source | SLO processing |
| Error | The error body received from the data source. The Error level only | SLO processing, Historical data retrieval |
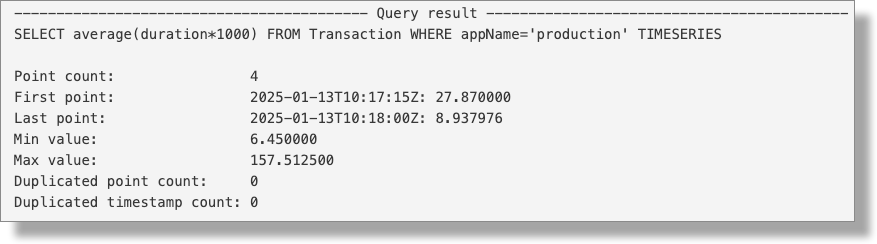
| Query result | The query body and response payload | SLO processing, Historical data retrieval |
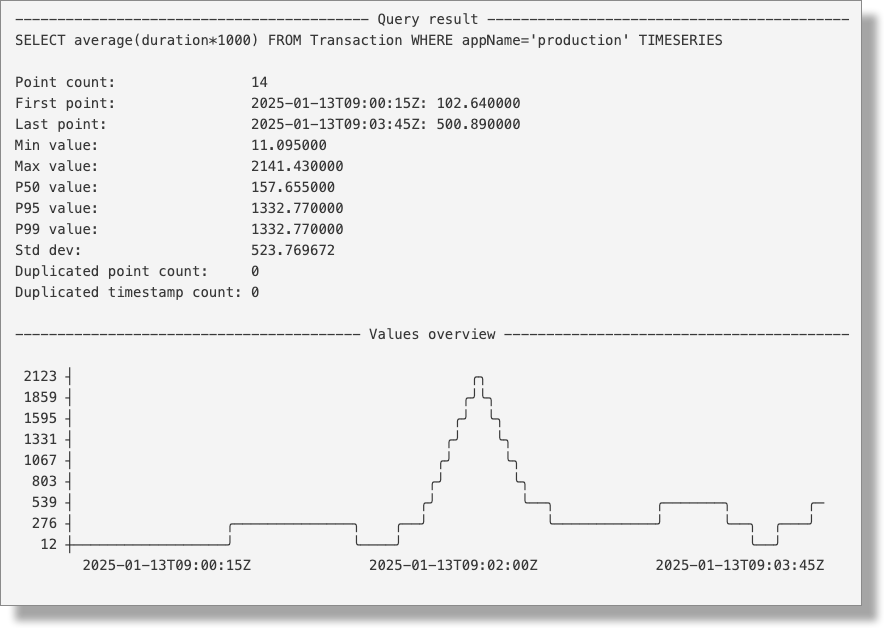
The Query result block includes the following details:
| Field | Description |
|---|---|
| First point and Last point | The timestamps and values of the first and last data point in the response for a given query |
| Min value and Max value | The value extremes in the response for a given query |
| Point count | The number of points received in the response for a given query |
| Duplicated point count | The number of duplicated points with the identical timestamps and values (if any) |
| Duplicated timestamp count | The number of duplicated timestamps with unique values (if any) |
Additionally, historical data retrieval logs include percentiles2 and the Value overview chart:
| Field | Description |
|---|---|
| p50 | The 50th percentile |
| p95 | the 95th percentile |
| p99 | The 99th percentile |
| StdDev | A standard deviation3 |
| Value overview | Value visualization over the retrieved time period |
2A percentile is a statistical measure that divides the SLI values received into 100 equal parts. Each percentile represents a specific point in the distribution, indicating the percentage of data points that fall below it. If the value of the 90th percentile is 250, you know that 90% of all other data points in the distribution fall below 250.
3A low standard deviation means most of the numbers are close to the average, while a high standard deviation means the numbers are more spread out.
- Nobl9 retains event logs for five days; older logs are automatically deleted.
- You can view up to 10,000 event logs per data source, with a maximum of 50 logs displayed per page.
- Each log entry includes responses from queries obtained within the request time window.
- If multiple SLOs use the same query, all relevant SLOs are listed in the log entry. Find them in the Affected SLOs list.
Event logs and RBAC
The following RBAC rules apply to the event logs feature:
- Organization admins can activate, turn off, view, and filter event logs
- Project owners and editors can view and filter event logs
Turning event logs on and off
- Nobl9 Web
- sloctl
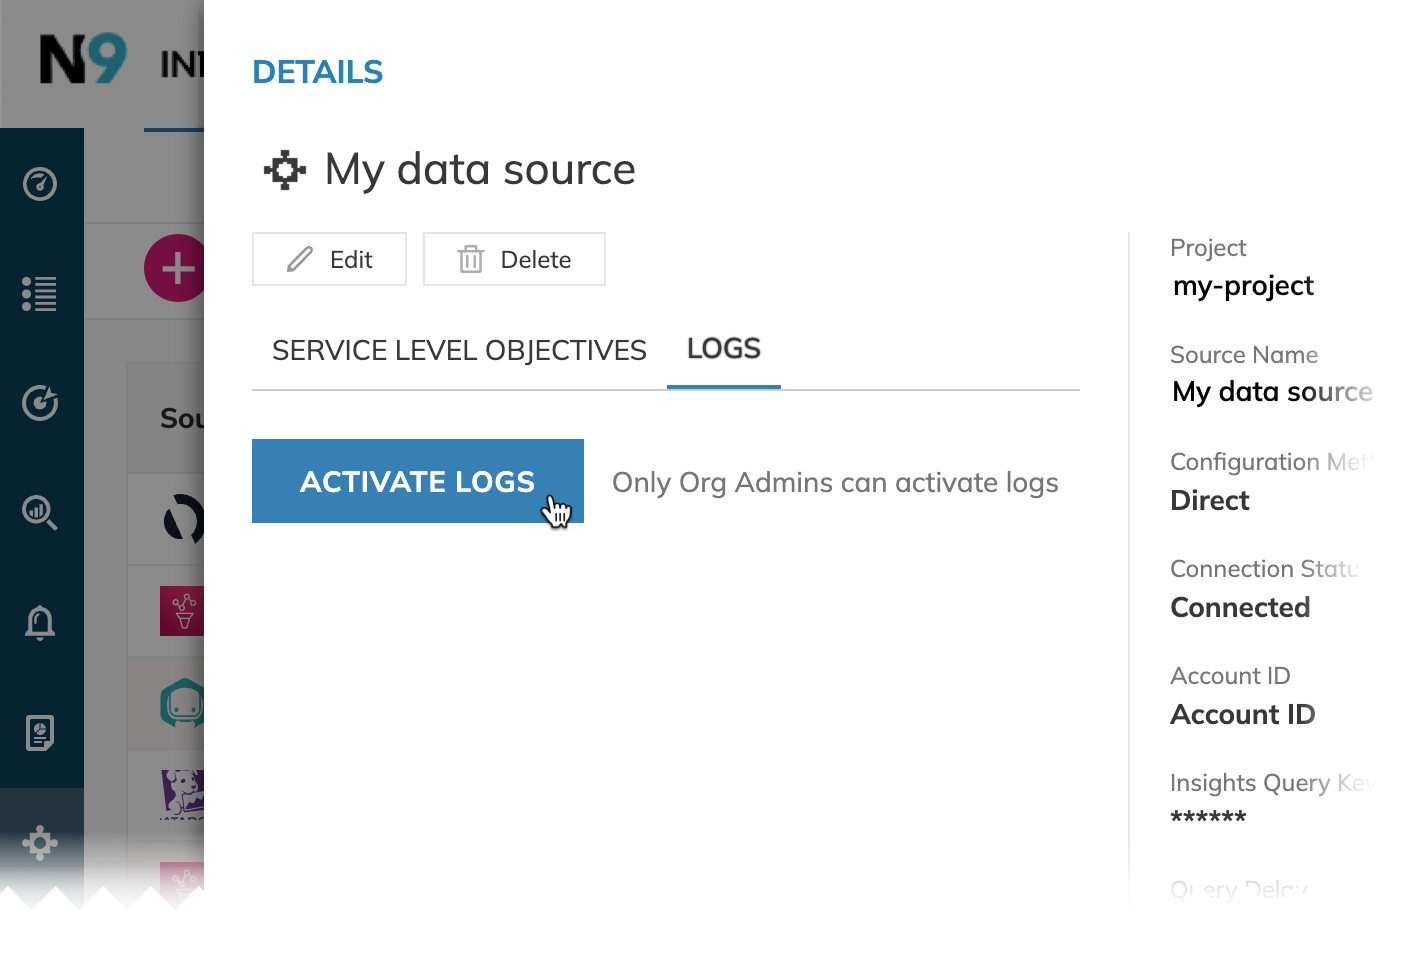
To activate event logs:
-
Go to Integrations > Sources.
-
Click the required data source connected with the direct method in the list to open its details.
-
Open LOGS. Click ACTIVATE LOGS:
To turn off event logs:
-
Go to Integrations > Sources.
-
Click the required data source connected with the direct method in the list to open its details.
-
Open LOGS. Click Turn off logs:
In some cases, Nobl9 can automatically turn off event logs. Should this happen, contact Nobl9 support for assistance.
Directs with the log collection support accept the logCollectionEnabled field (boolean) in their YAML definition.
To turn on log collection, set logCollectionEnabled to true:
- apiVersion: n9/v1alpha
  kind: Direct
  metadata:
    displayName: My data source connected with the direct method
    name: my-data-source
    project: default
  spec:
    [...] # Source-specific fields
    [...] # Historical data retrieval parameters
    logCollectionEnabled: true
To turn off log collection, set logCollectionEnabled to false:
- apiVersion: n9/v1alpha
  kind: Direct
  metadata:
    displayName: My data source connected with the direct method
    name: my-data-source
    project: default
  spec:
    [...] # Source-specific fields
    [...] # Historical data retrieval parameters
    logCollectionEnabled: false

