Nobl9 application (1.79.3)
Release details
new SLO details 2.0
We're thrilled to announce the launch of a brand-new design for SLO details!
We've been working hard to make it visually appealing, more intuitive, and user-friendly.
Here are some of the most prominent changes you'll notice:
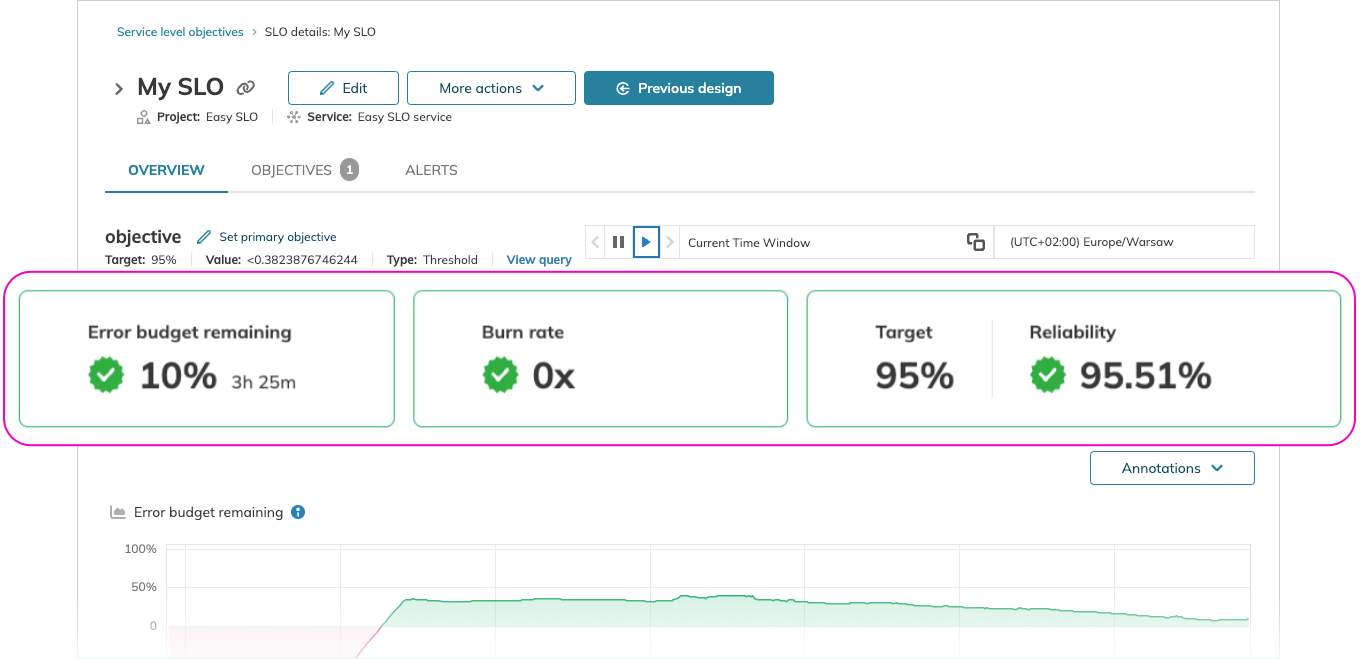
- Streamlined interface. The remaining error budget, burn rate, and reliability tiles relate to your SLO's primary objective, which you set to access its insights instantly. This will make it easier to grasp the most essential information. The rest of the objectives are visualized under the dedicated Objectives tab.
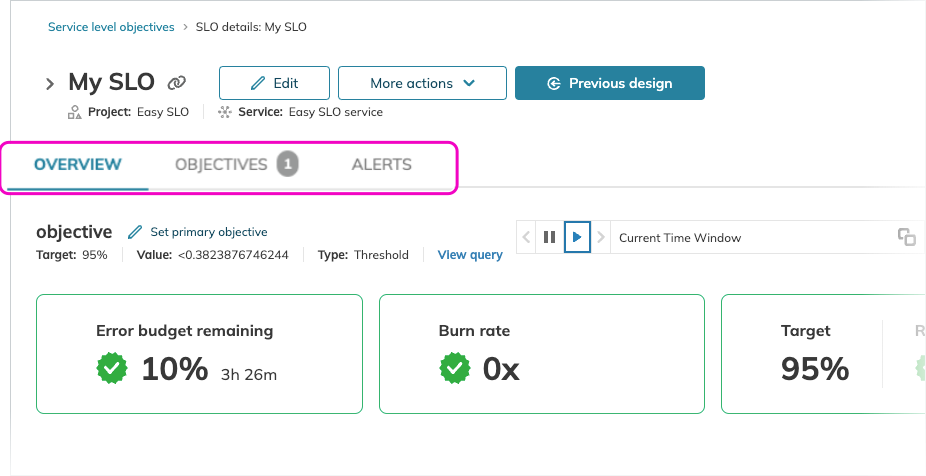
- Enhanced information display. The new design introduces tabs: Overview, Objectives, and Alerts. While the Overview tab focuses on your primary objective’s details, the Objectives tab covers insights into the rest of the objectives your SLO holds. This will allow you to navigate through your SLO details more efficiently and present information on each objective more clearly.
The Alerts tab is currently under active development. It will comprise alerts added to your SLO.
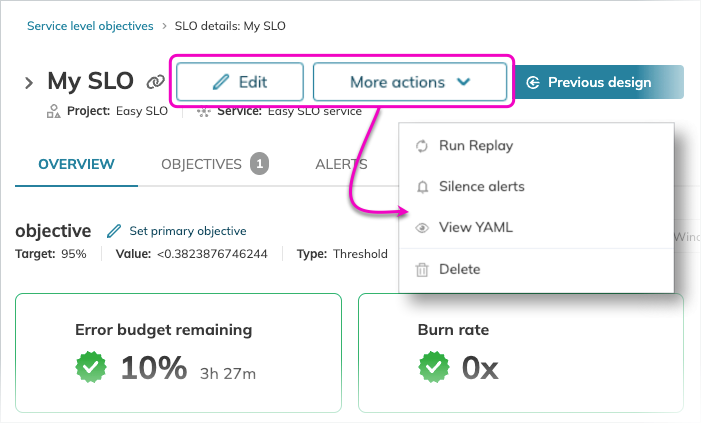
- SLO management options at your hand. Find all the steering options close to the SLO name.
Explore the new design and discover all the improvements yourself!
For this, go to your selected SLO details and click Try SLO details 2.0:
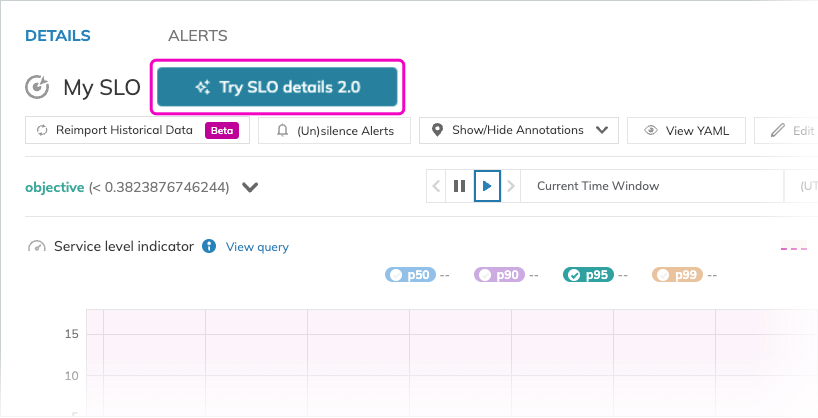
To ensure a smooth transition, we'll be rolling out the new design in three phases:
Phase 1: Choice & Familiarity (Current)
You now have access to both SLO details looks.
By default, the interface you're familiar with will be open.
Feel free to explore the new design at your own pace.
Phase 2: SLO details 2.0 takes center stage
In the next phase, you'll still have access to both interfaces.
But now, SLO details 2.0 will be open by default.
So you have a chance to experience the new functionalities and layout more readily.
Phase 3: Streamlining the experience
Finally, we'll transition to offering SLO details 2.0 exclusively.
The previous design will be phased out to ensure a consistent and improved user experience.
We'll keep you informed as we move through each phase.
Here are some additional things to keep in mind:
- All your existing data and functionality are still readily available.
- During the first two phases of the transition period, the previous SLO details design will be accessible along with SLO details 2.0.
- We've created a helpful guide to walk you through the new features.
We hope you enjoy the fresh look and feel of the SLO details!
improved New alerting capabilities
We're excited to announce the expansion of our alerting capabilities. These new features are designed to provide better insights into your system's reliability and offer you more control and flexibility in setting up, managing, and responding to alerts.
Multi window multi burn rate alert condition
You can now set up a flexible alerting method known to SREs as multi-window multi-burn. This approach incorporates the popular "slow burn" and "fast burn" techniques. With it, you can define multiple alerting windows with granular control. Each window can have its own specific burn rate, ensuring alerts are triggered precisely when needed. This method effectively tracks rapid, significant error spikes (fast burns) as well as slower, sustained increases (slow burns). By setting alerts for these conditions, you can promptly address short-term issues and, at the same time, keep an eye on longer-term trends that may affect the overall error budget.
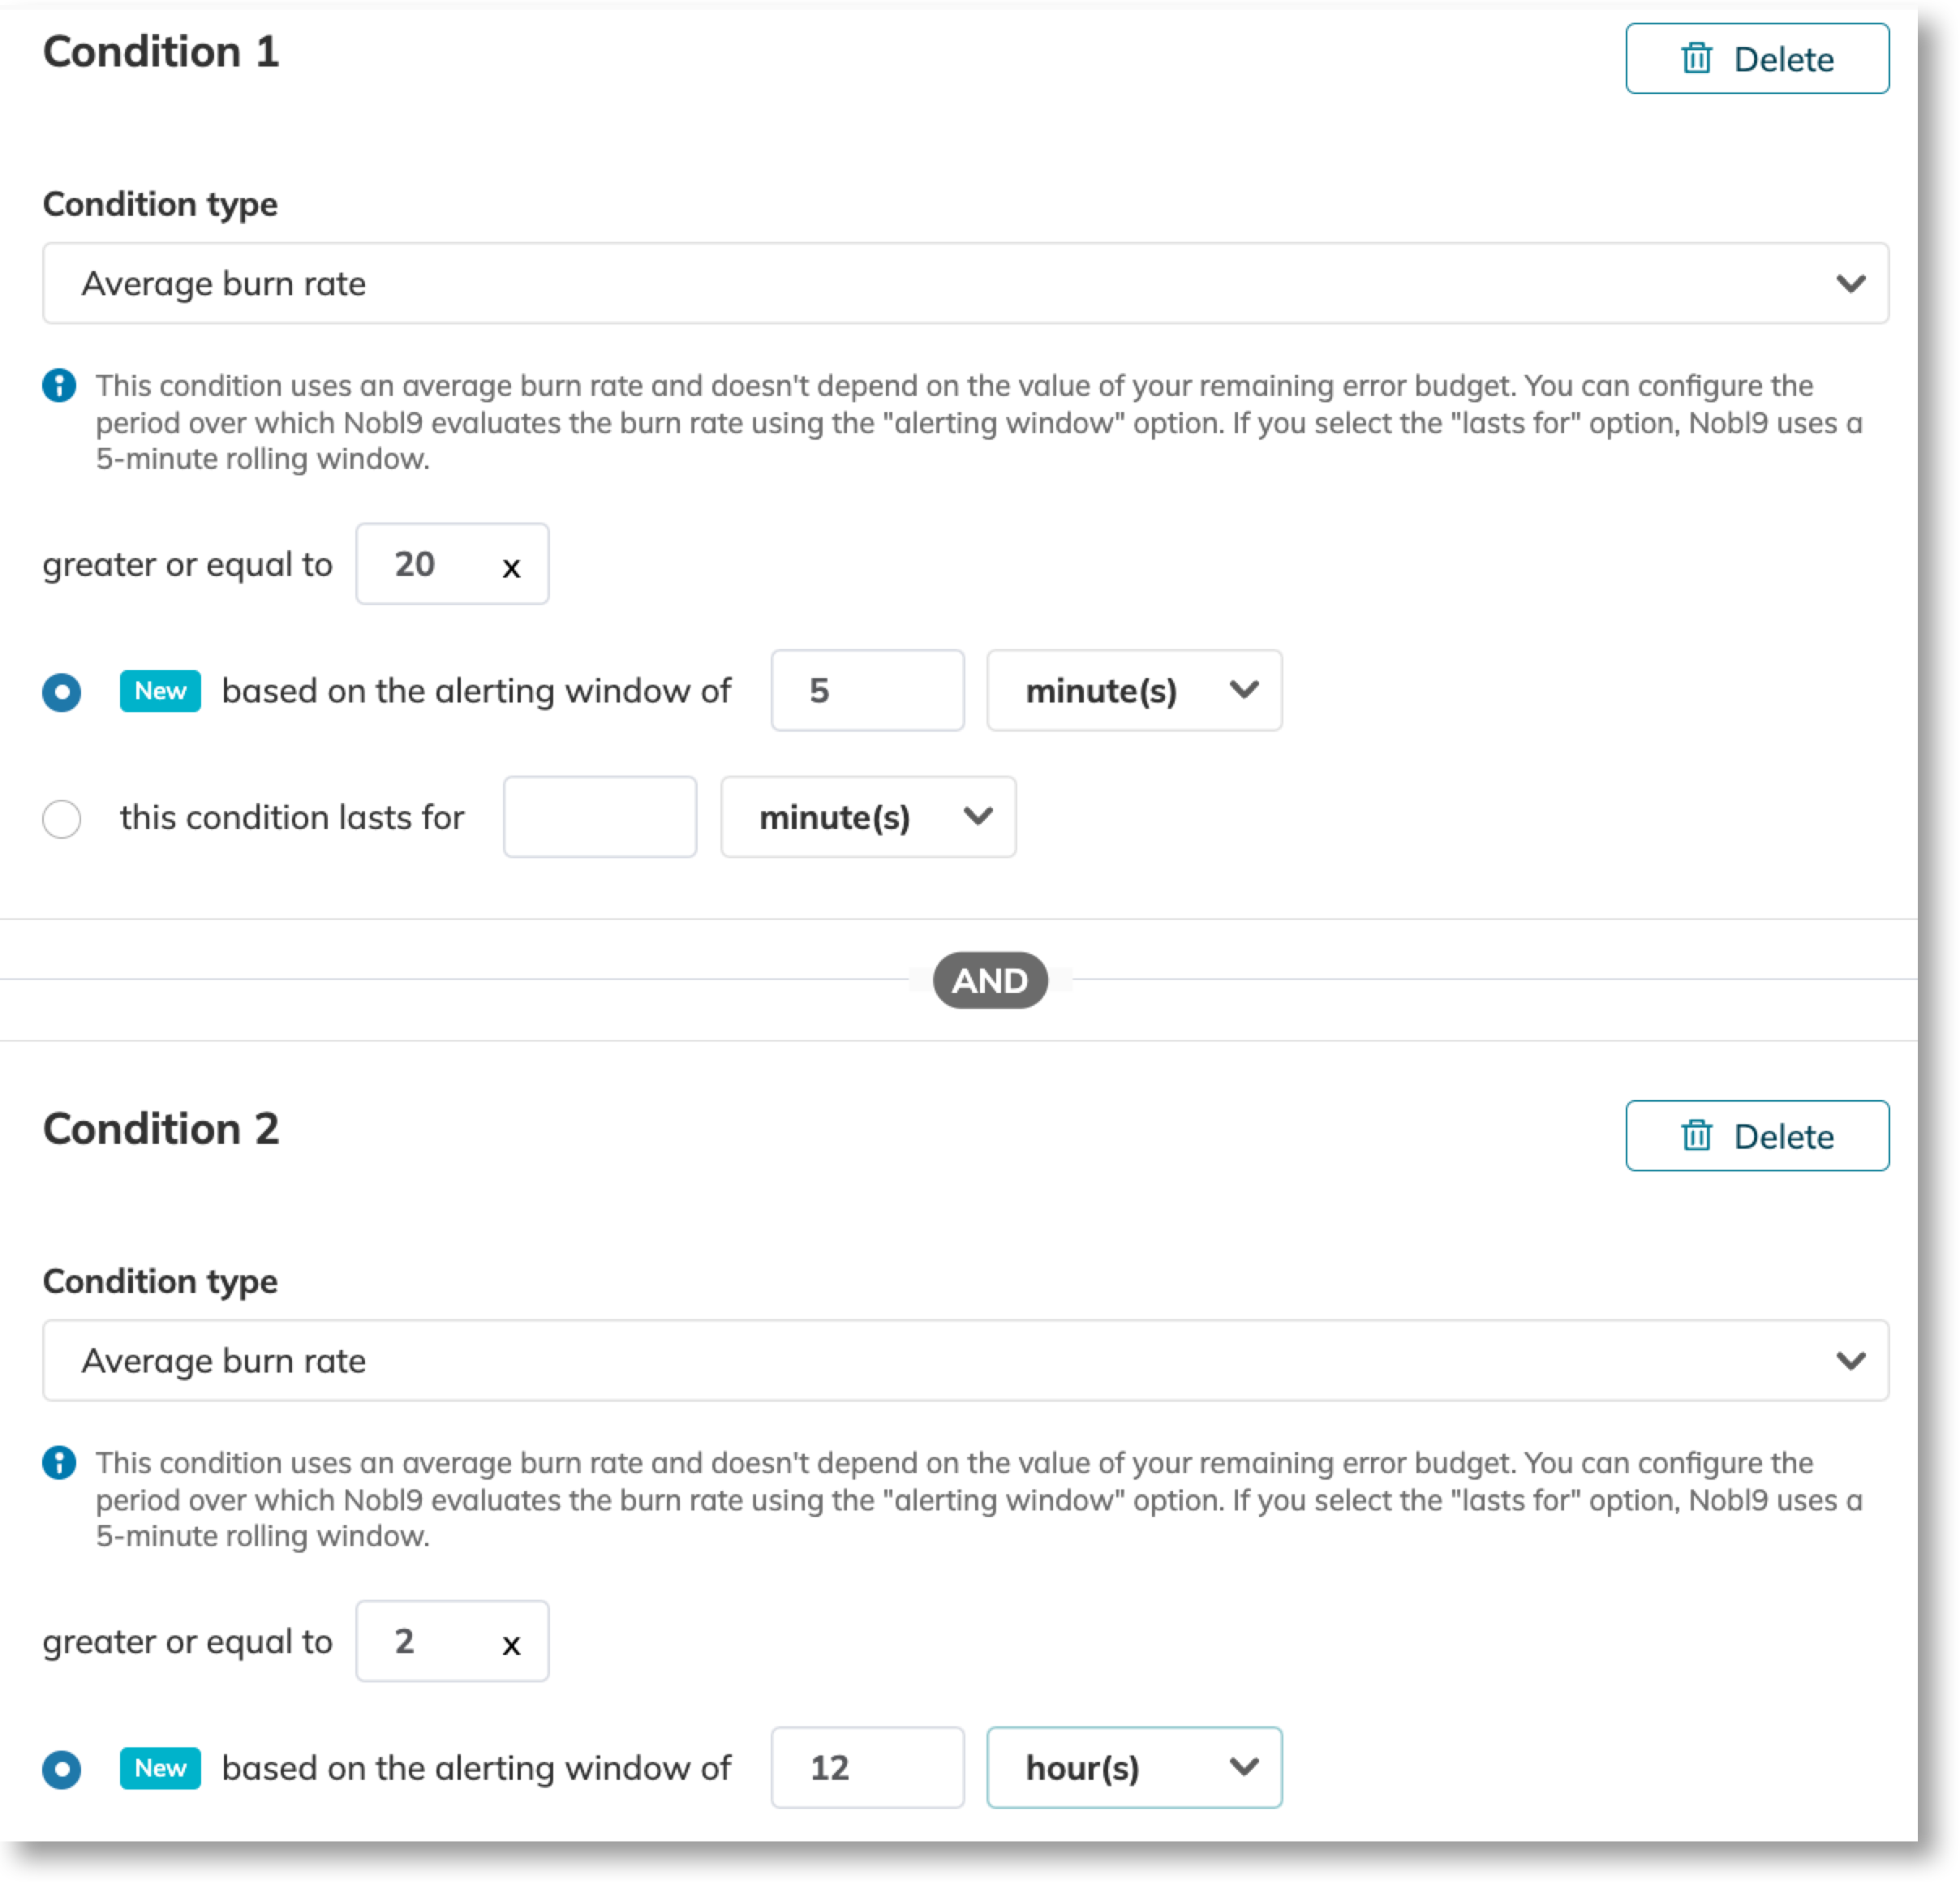
More about alert conditions
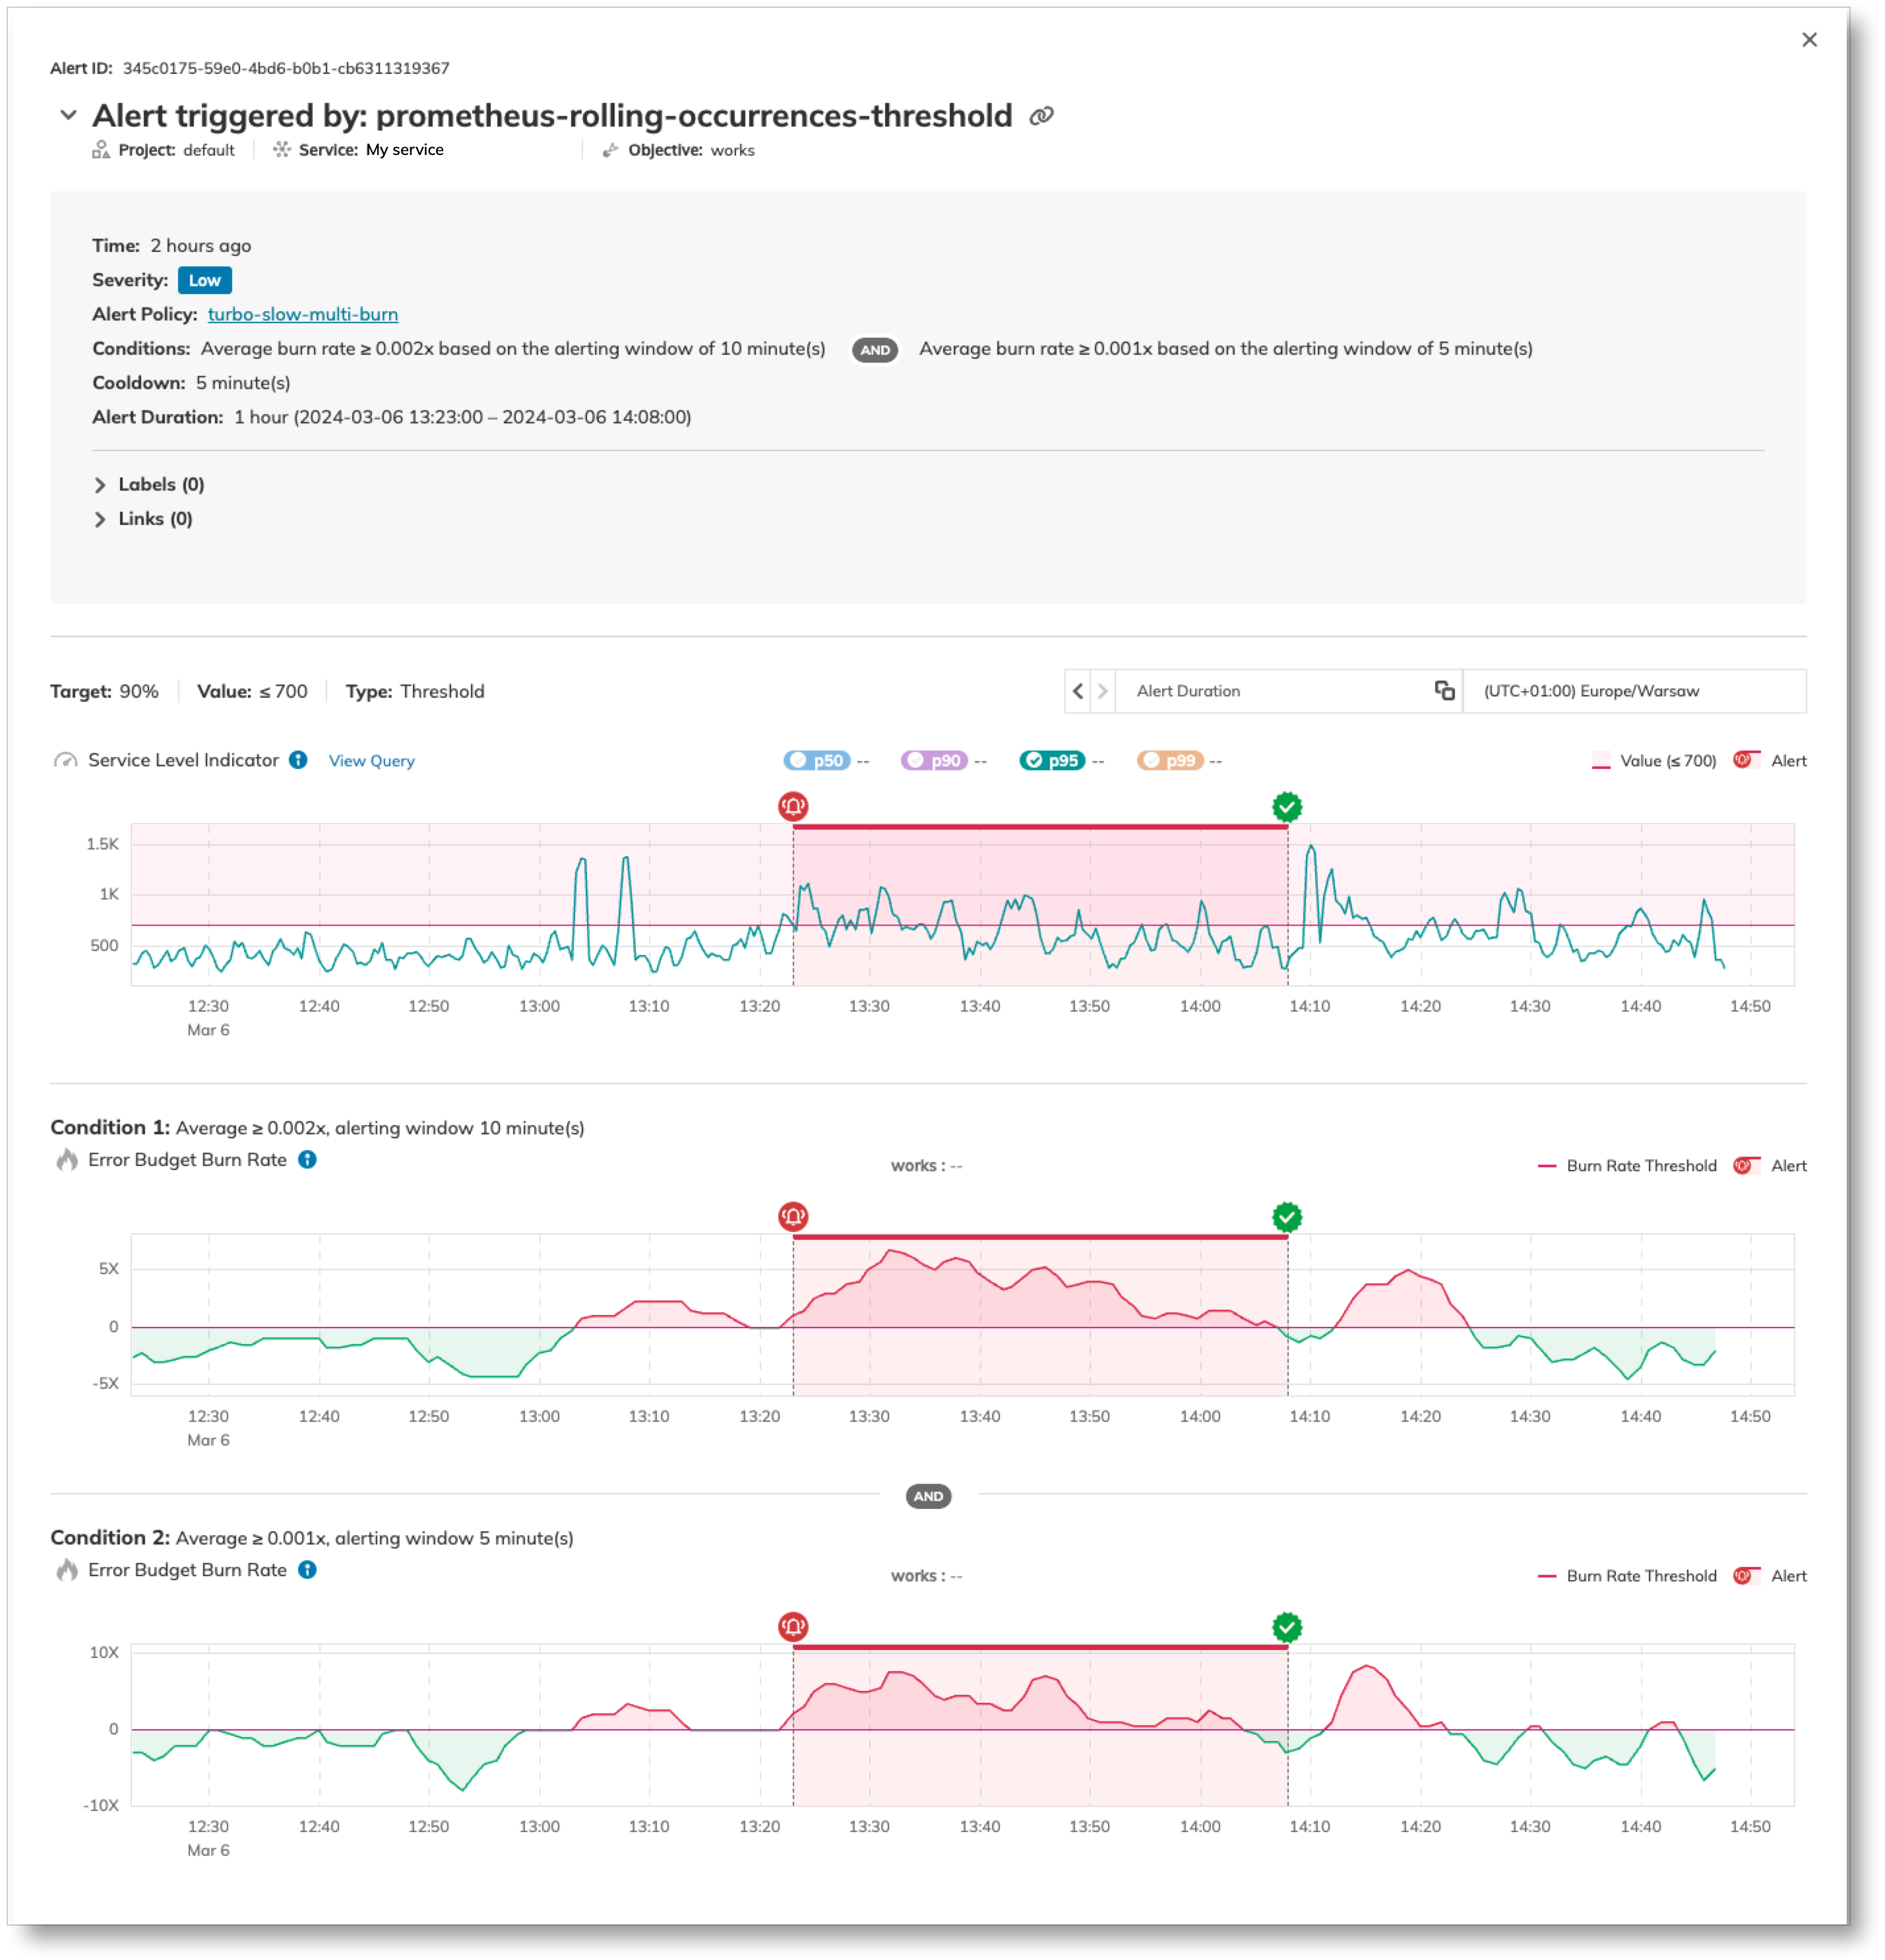
Enhanced alert details
Our new, improved alert details view provides a deeper dive into alert management. Integrated detailed charts combining alert measurement data and SLI charts help you better understand why each alert was triggered.
Alert presets
Setting up alert policies has never been easier. Our updated alert policy wizard now includes preset configurations tailored for common use cases.
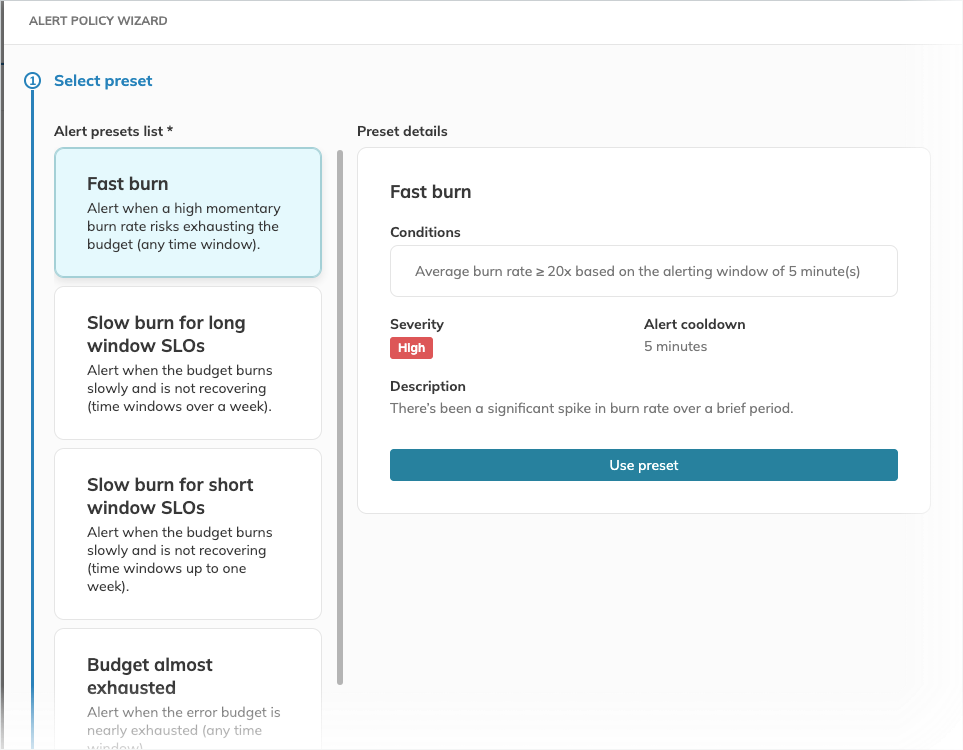
Your current configurations remain intact, as no automated changes are made to existing alert policies.
improved Alert details
Check your alert details and catch the new Replay status message box. It indicates the SLI data that triggers the alert has been reimported, so the data you see may be historical instead of current. Additionally, the alert details URL now includes a time range, making it easier to share your manually adjusted alert view with others.