SLO details
The SLO details page provides comprehensive information about individual service level objectives, allowing you to monitor performance, manage configurations, and track historical data. To access this page, click an SLO name from the SLO list or grid.
Page overview
The SLO details page offers several key capabilities.
- Monitor performance: View real-time reliability metrics and error budget consumption
- Manage configurations: Edit SLO settings, move between projects, or delete SLOs
- Track history: Review changes, annotations, and alert activity
- Conduct reviews: Assess and update SLO relevance (Enterprise)

The SLO header provides quick access to common management options:
Table: SLO and SLO display management options
| Action | Button | Description |
|---|---|---|
| View metadata | Displays SLO configuration details | |
| Share SLO | Copies a direct link to this SLO with current time window settings | |
| Edit configuration | Opens the SLO wizard to modify settings | |
| More actions | Run Replay1, silence alerts, view SLO YAML, copy and move the SLO, handle budget adjustments, select displayed objectives2, manage chart visibility and order3, and delete the SLO. |
1Run Replay is inactive when this SLO is being replayed and when the maximum period for historical data retrieval is set for its data source to 0.
2Select objectives is available when you're on the Objectives tab and when the SLO contains two or more objectives.
3Manage charts options apply to all SLOs you view. Once you set chart visibility for one SLO, you'll see the same for all SLOs.
The time window next to the SLO options indicates which period the SLO data is displayed for. By default, the time window matches the time window configured for this SLO. You can rewind, pause, and resume the time window.
Review status (
Table: SLO review statuses
| Status | Description |
|---|---|
| Not started | No review has been scheduled for SLO's service |
| To review | A review is scheduled and is upcoming |
| Reviewed | A user has reviewed the SLO and manually marked it as reviewed |
| Overdue | A scheduled review was not completed on time |
| Skipped | A user has intentionally skipped a scheduled review |
On the review status transition, Nobl9 generates an annotation with the editable review note. You can specify the reasons for the status transition there.
Learn more about reviews, status transitions, and tips on how to perform an SLO review.
Page structure
The SLO details page comprises five tabs. They organize the focus areas of your SLO.
- Overview: Primary objective performance and key metrics
- Objectives: All objectives of your SLO with individual charts and summaries
- Alerts: Alert policies, active alerts, and alert silence controls
- Change history (Enterprise): Configuration modifications list
- Annotations: Manual and system-generated annotations added to your SLO
Overview and objectives tabs
The Overview and Objectives display the charts and parameters of the objectives your SLO includes.
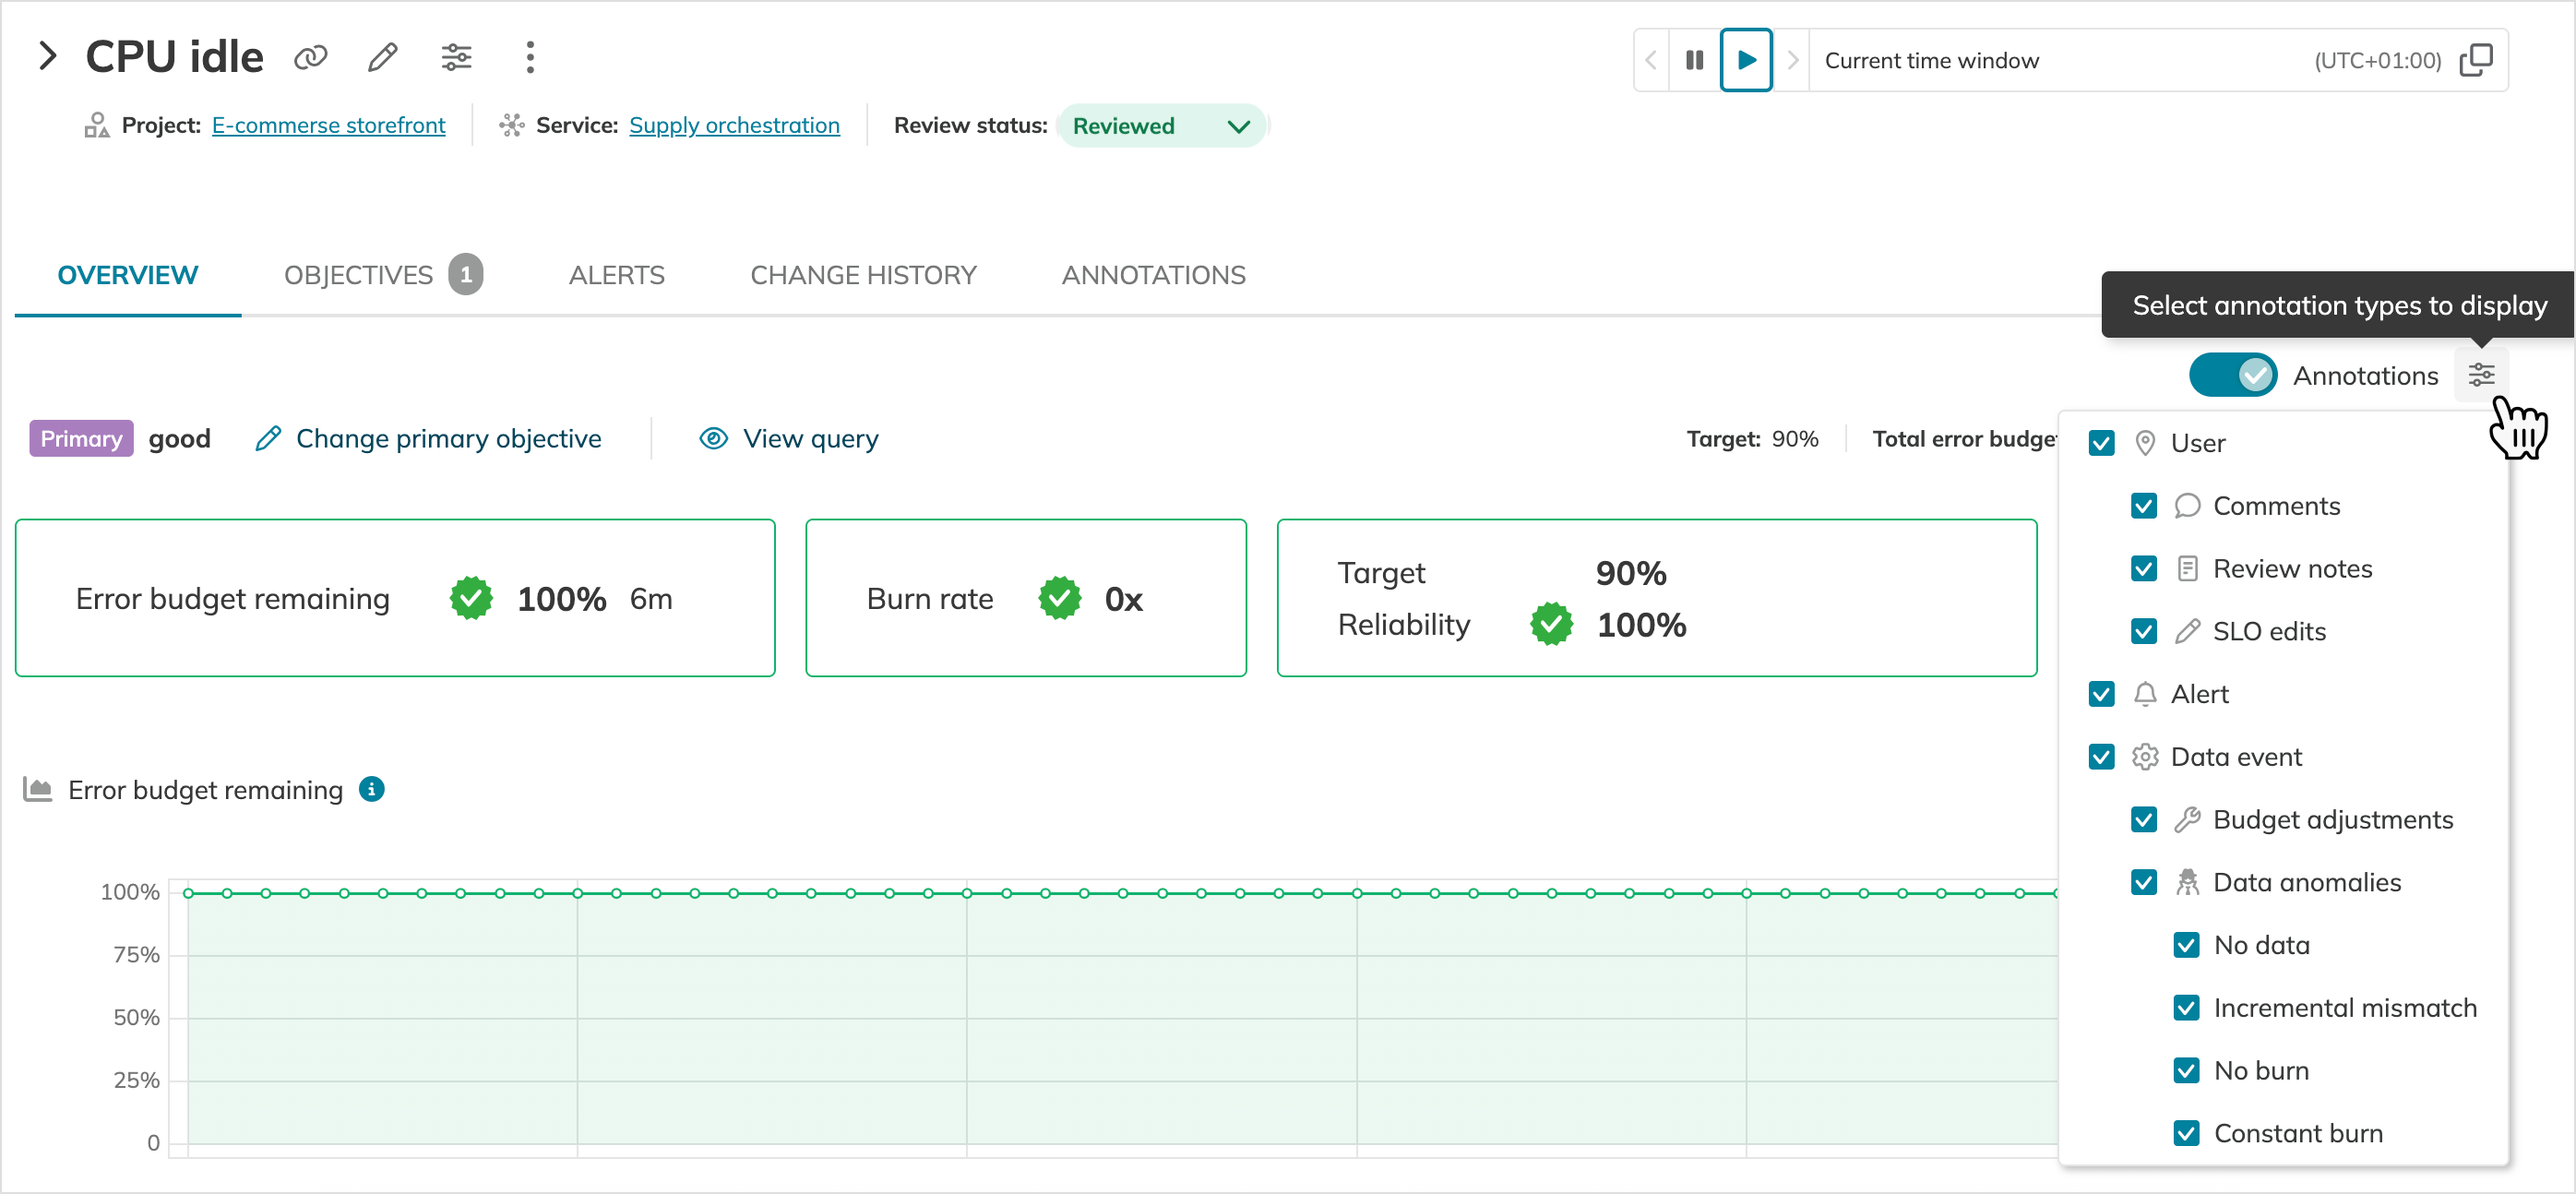
The Annotations switcher is available under each of these tabs.
Use it to show or hide annotations on objectives' charts.
You can also select annotation types to display.
For this, click ![]() next to the Annotations switcher and pick the required annotation types:
next to the Annotations switcher and pick the required annotation types:
Next to each objective, you can find its parameters:
| Parameter | Description |
|---|---|
| Target | The minimum performance level set for this objective. The target must be achieved within the SLO's time window to meet the objective. |
| Total error budget | The amount of the error budget this objective has within the current time window |
| Value threshold metric only | The comparison operator and the value set for this objective |
| Type | The metric type of this SLO—threshold or ratio |
The Overview tab focuses on your SLO's primary objective, displaying the most critical performance indicators and recent activity.
The primary objective is an objective that takes center stage on the SLO details page. It is labeled with
The Objectives tab displays all objectives of your SLO, including the primary objective.
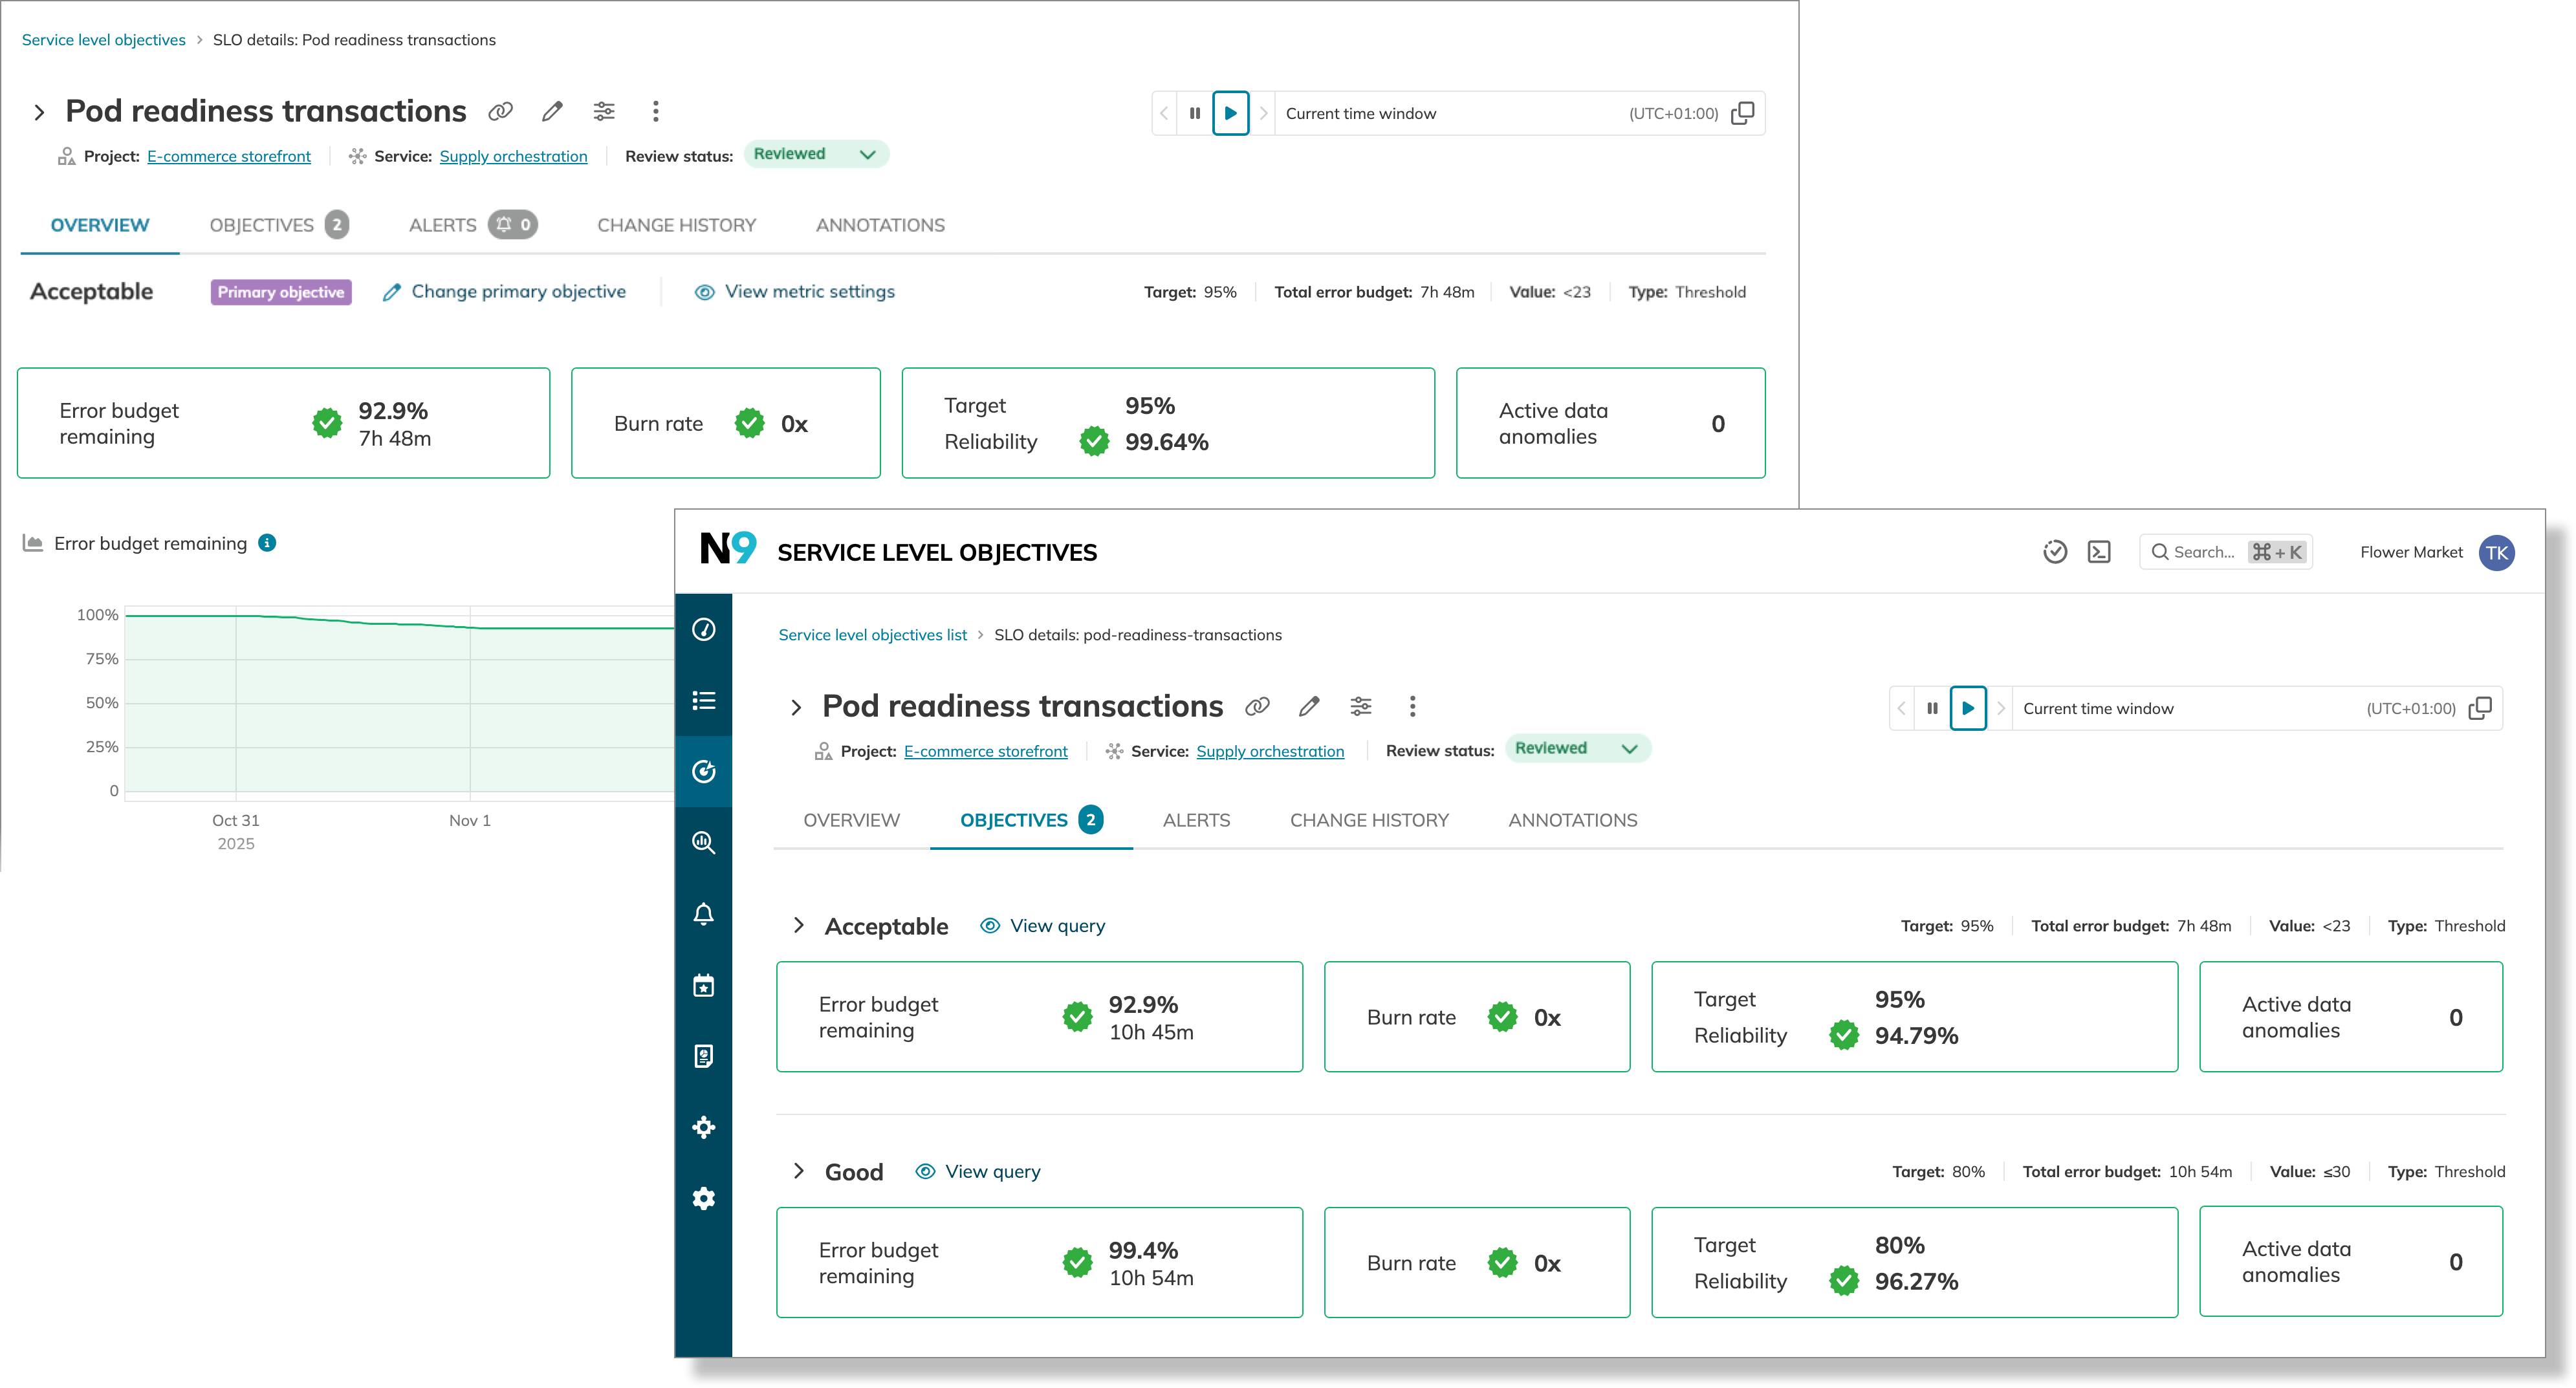
Tiles and charts
The tiles and charts on the Overview and Objectives tabs visualize your SLO objectives' reliability, performance, and collected data points.
The tiles display the most critical information about your SLO and its objectives. They provide a snapshot of the most recent data, covering two categories:
- Reliability values focus on the last seven days of the selected time window
- The error budget remaining (in percent)
- The burn rate
- The reliability target, along with the current reliability value
- Real-time event count surfaces events affecting your SLO at the present moment
- Active alerts show the number of unresolved alerts
- Active data anomalies display the number of unresolved data anomalies. All detected data anomalies are taken into account—with manual or auto-detection rules
The counts of active alerts and data anomalies you see indicate how many of them are unresolved at the present moment. As soon as an alert or data anomaly is resolved, the count on the tile decreases.
Live updates are paused if you pause the time window. In this case, the tiles display a snapshot of the unresolved counts at the moment the time window was paused and will not update until it resumes.
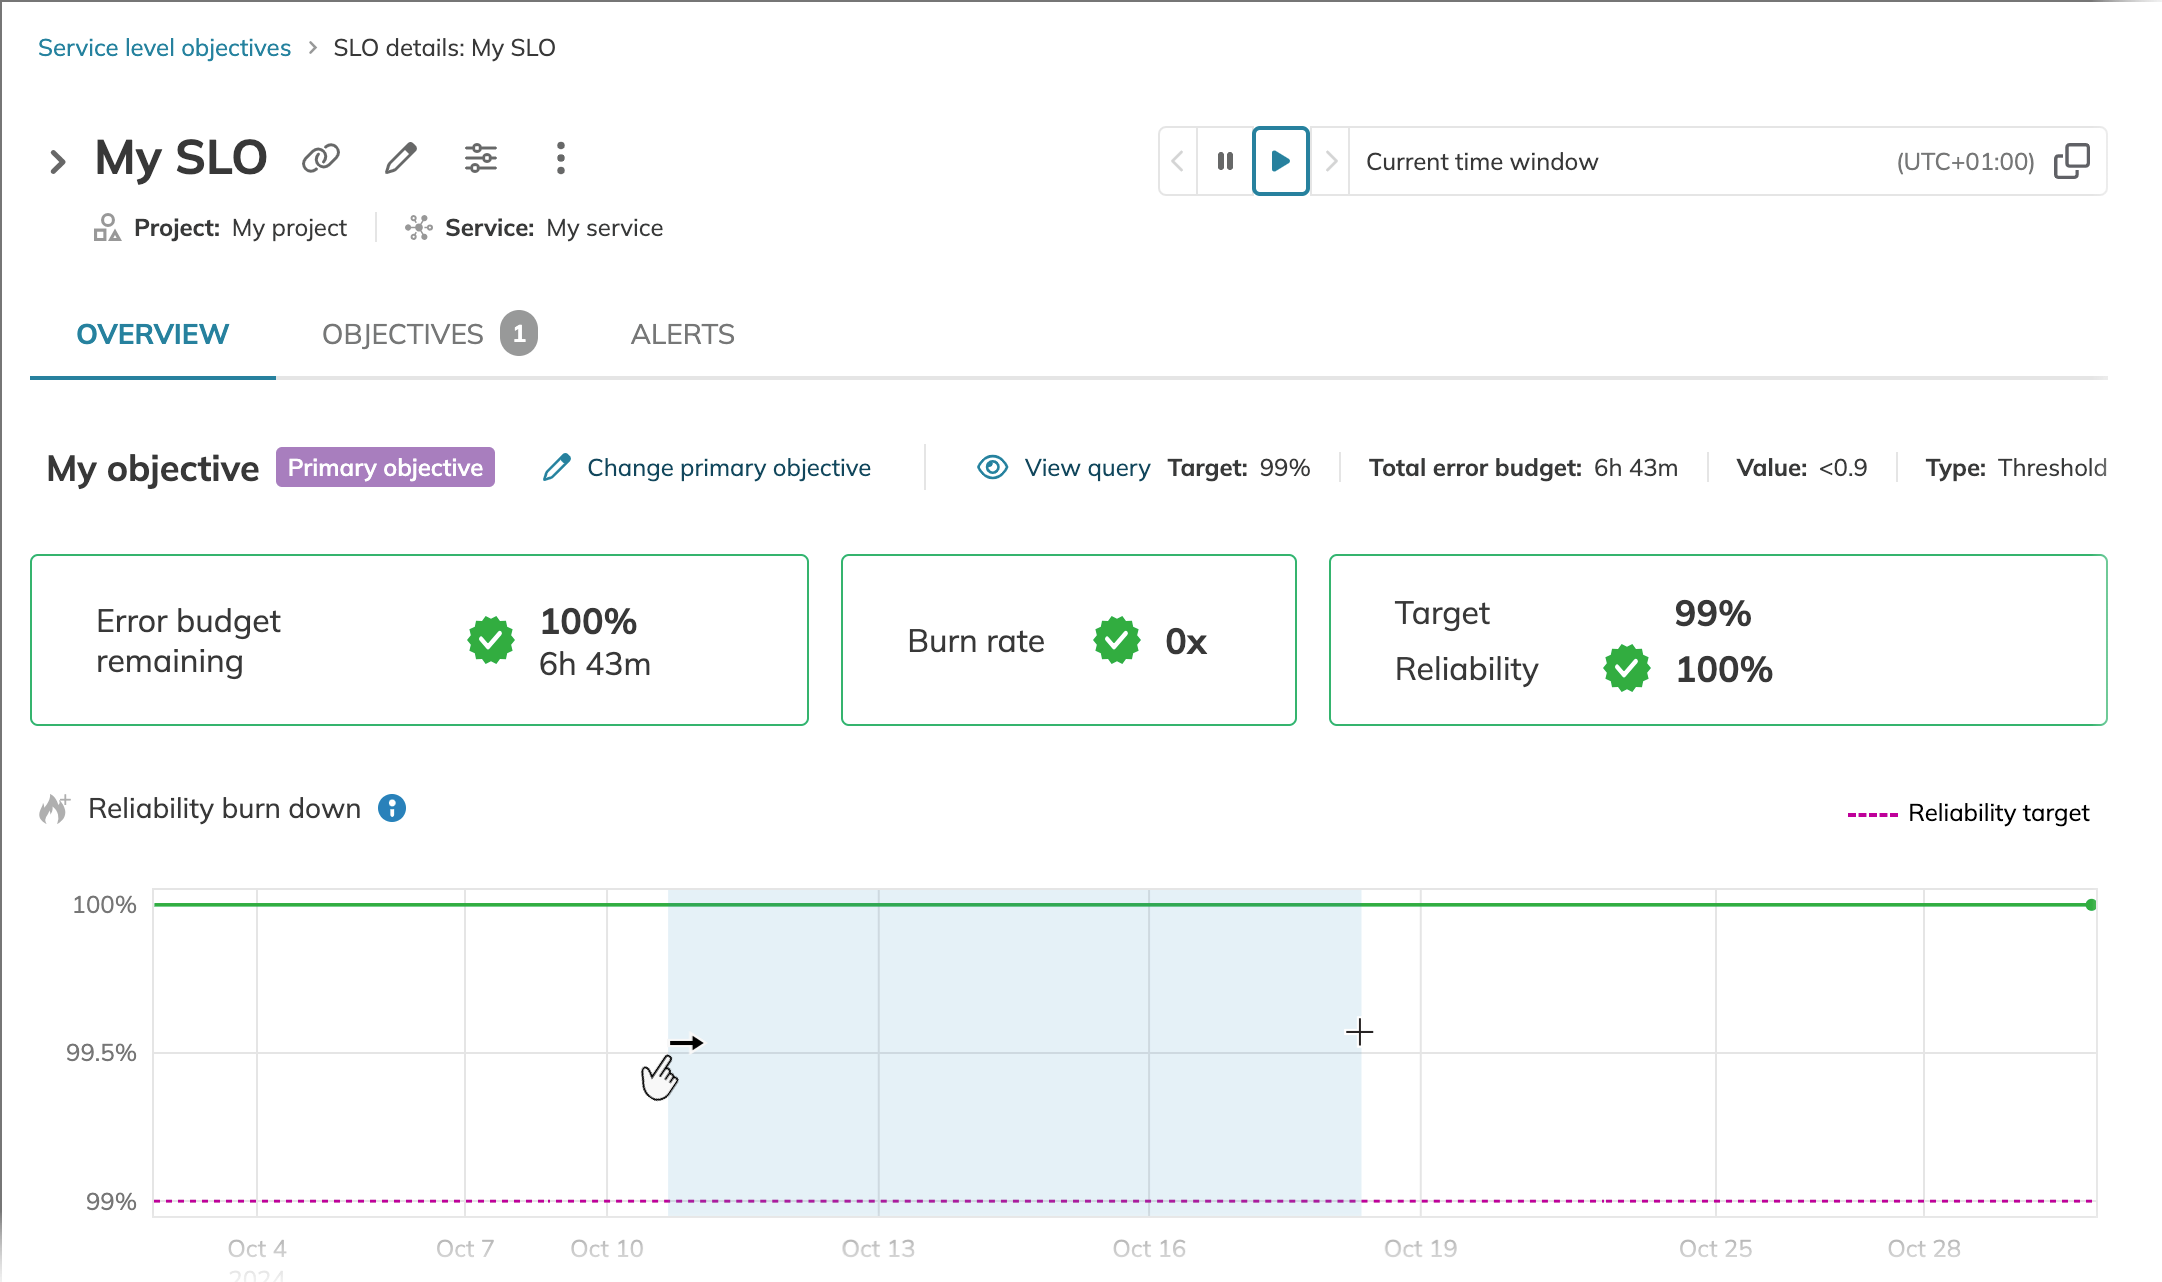
Below the tiles, the charts visualize the reliability parameters of the objective currently in focus. The charts cover the entire time window selected and include the following:
- The error budget remaining
- The reliability burn down
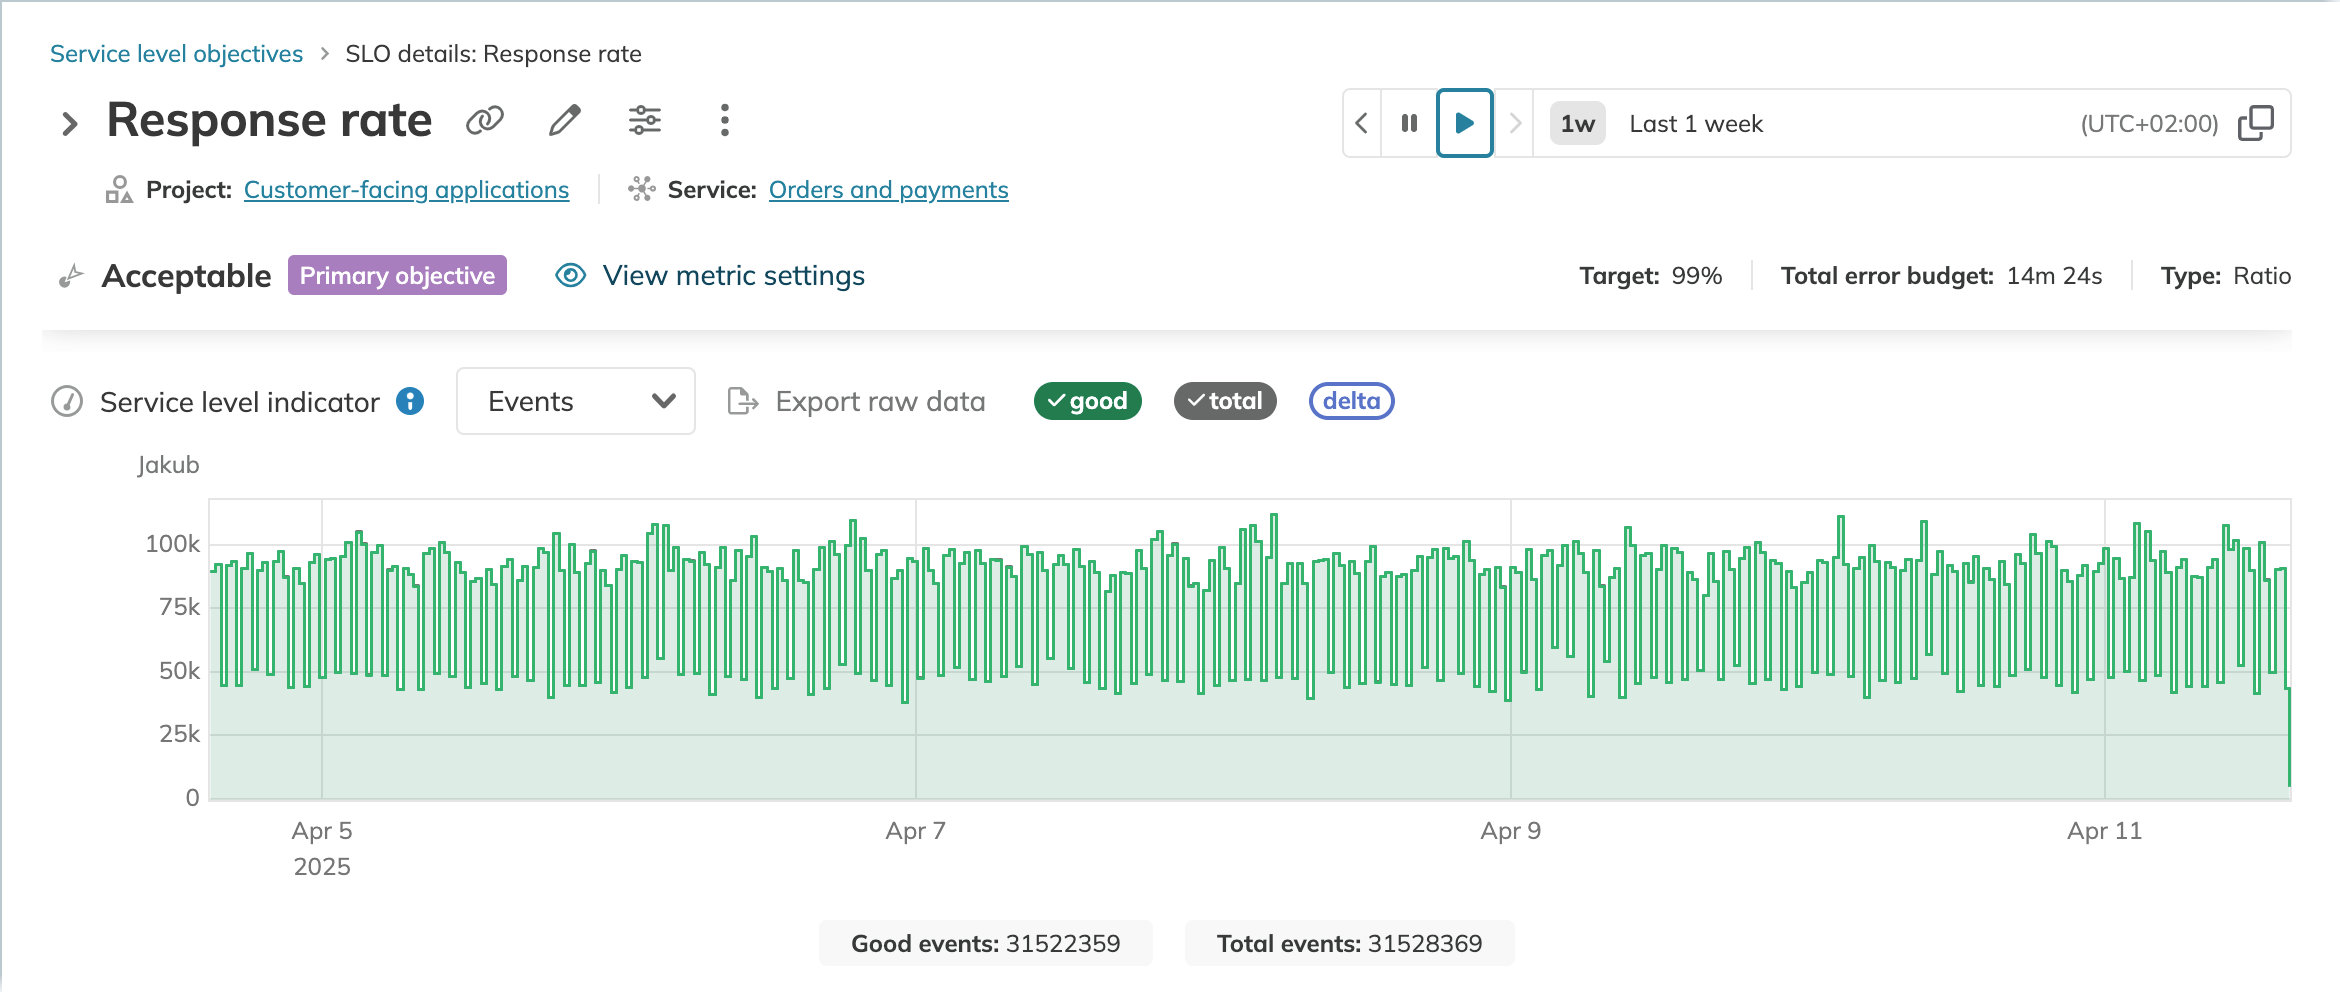
- The service level indicator
- The error budget burn rate
The Service level indicator (SLI) chart visualizes the data points collected by your SLO. Its appearance varies depending on the metric type (threshold or ratio). For ratio metrics, the chart's appearance also depends on the data count method. Non-incremental ratio metric charts feature two key elements:
- The option to select the display mode
- Counts of good (or bad) and total events received over the selected time window
Wider time windows show aggregated (downsampled) data, where the aggregation method is also determined by the metric configuration.
Read more about SLI aggregations.
You can zoom in the charts to access raw SLI data. To zoom in on a specific time range, click and drag on the desired area of the chart. You can drag in both directions.
When you modify reliability targets, you may see temporary visual inconsistencies where tile colors don't reflect actual performance. This occurs because Nobl9 recalculates values based on the new target as fresh data arrives.
Such a mismatched period remains in SLO history and is visible on rewinding the time window back to this period. It can be overwritten by reverting the target to its previous value or replaying the SLO1 with the new target.
1The maximum period for historical data retrieval per data source is applied.
SLO alerts
The Alerts tab centralizes all alerting information for your SLO, including linked alert policies, active alerts, and silence controls. This provides a complete view of your SLO's alerting ecosystem in one location.
The badge next to the tab name shows the count of currently active (unresolved) alerts.
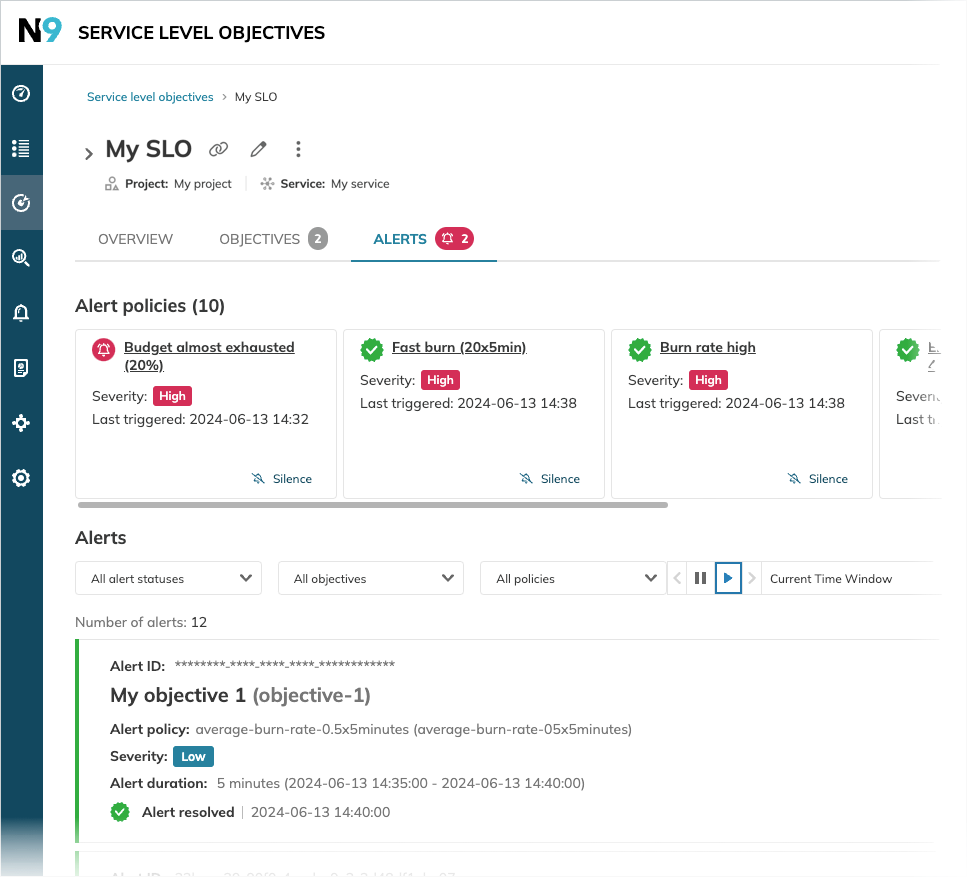
The top section displays tiles for each alert policy linked to this SLO, providing the following:
- Alert policy identification—name, severity level, and current status
- Activity summary—most recent alert trigger time (if any)
- Quick actions—silence or resume alerts directly from the tile
Table: Alert policy status icons, descriptions, and steps to address the status
| Status icon | Meaning | Next steps |
|---|---|---|
| Currently alerting | Investigate the underlying issue or silence temporarily | |
| Alert resolved | No action needed - monitor for recurring issues | |
| Alert silenced | Review silence duration or resume if issue is resolved | |
| No icon | No alert triggered | Policy is active but conditions haven't been met |
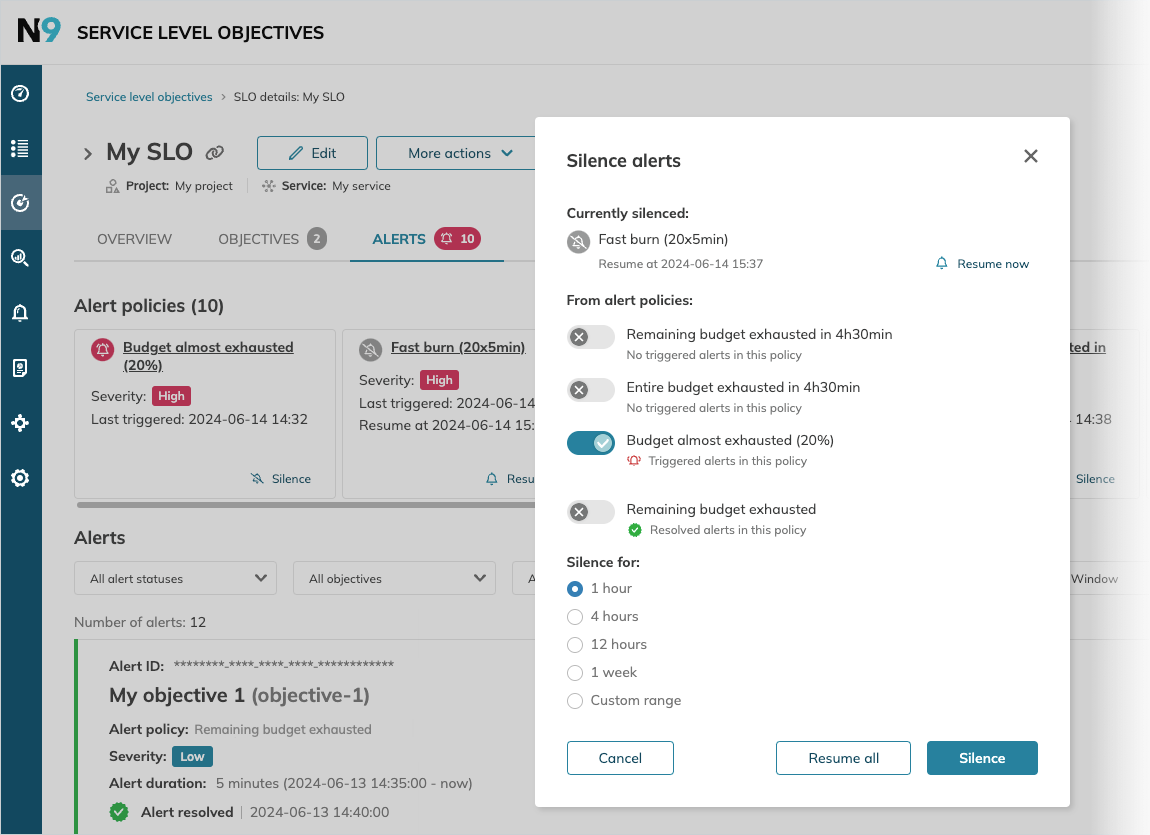
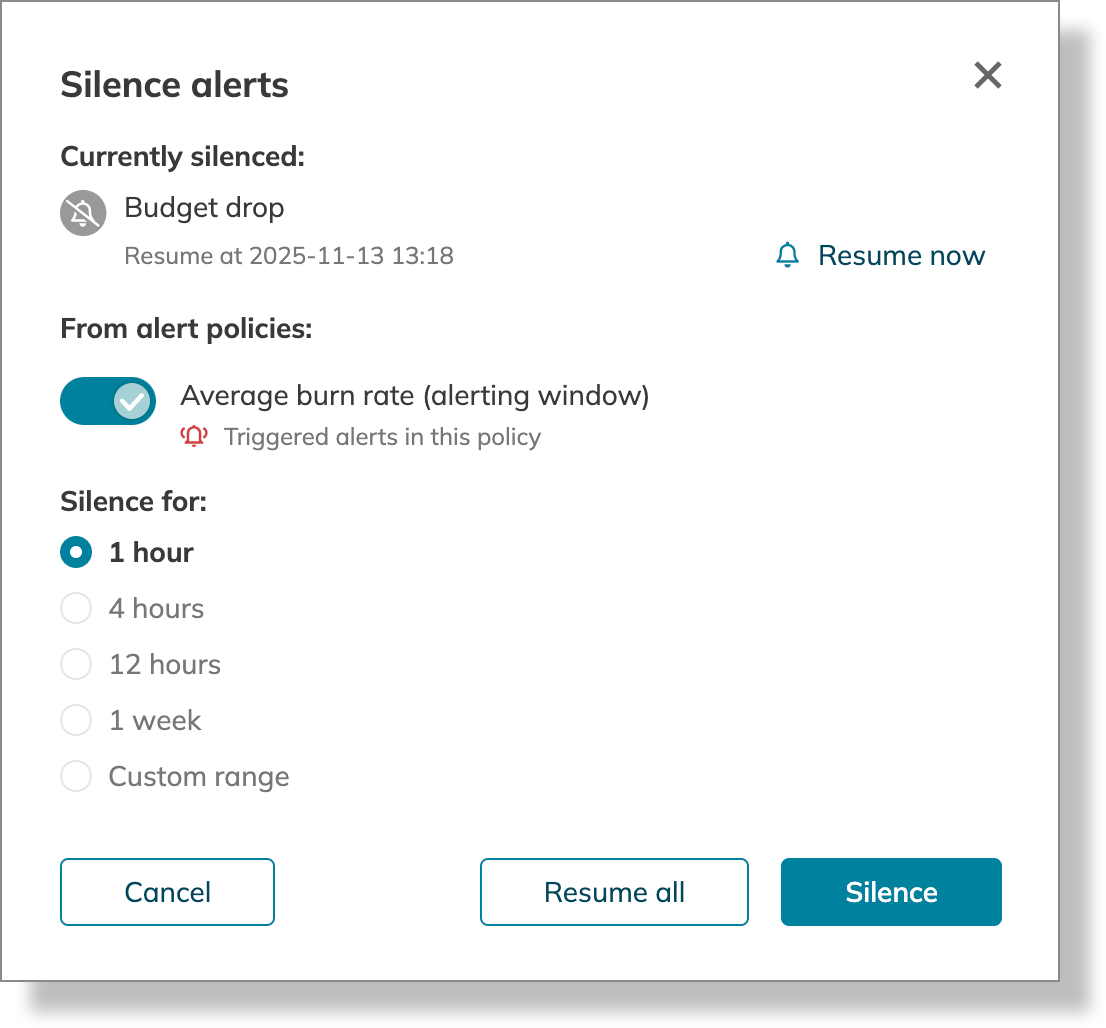
Alert handling
To temporarily suppress alert notifications:
- Locate the alert policy tile you want to silence.
- Click Silence in the tile.
- Optional: Select additional alert policies to silence.
- Select the silence duration.
- Click Silence to confirm.
Consider silencing alerts during:
- Planned maintenance windows
- Known issues being actively worked on
- False positive periods while tuning alert thresholds
If you have any alert policies silenced, they're listed in the Currently silenced section. You can resume individual alerts or all alerts at once.
Triggered alerts
Below the policy tiles, the Alerts section lists up to 1,000 recent alert events, with the newest displayed first. Click any alert to view its detailed information.
By default, you see alerts that have been active within the SLO's current time window. The newest alerts are displayed first. To change this, select another period in the time picker.
Narrow down the alert list using these filters:
| Filter type | Options | Use case |
|---|---|---|
| Alert status | All, Triggered, Resolved | Focus on active issues or review resolved incidents |
| SLO objective | Any objective in your SLO | Identify which objectives trigger most alerts |
| Alert policy | Any linked policy | Analyze specific policy effectiveness |
When you filter by two or more criteria, the results satisfy all of them—Nobl9 applies the AND logical operator.
For example,
filtering by Triggered status and a specific objective shows only currently active alerts for that objective.
Alert history is only maintained for resources that currently exist in your Nobl9 organization.
- Deleted resources: Alerts disappear when SLOs, services, or alert policies are deleted
- Recreated resources: Even if recreated with identical names, the previous alert history is not restored
- Unlinked policies: Alerts are hidden when alert policies are disconnected from the SLO
SLO history and annotations
The Change history (
Change history
The changelog records each modification with:
- Event type—what was changed
- Timestamp—when the change occurred
- Changed by—who made the change
- Tool—where the change originated (Nobl9 web application, API, Nobl9 Terraform provider,
sloctl, Nobl9 SDK for Go)
Annotations
The Annotations tab centralizes all annotations applied to the SLO within the selected time window:
- Displays user, alert, and data event annotations whose Applied to time falls inside the window
- Filters by type, label, or author for quick navigation
- Jump to the corresponding point on the SLI chart with Open in SLO details
Useful links

 Time windowsSLO guidesError budgetGlossaryError budget calculation methodsSLO guidesCreating SLOsData sourcesQuery parametersNobl9 featuresSLO reviewsSLO oversightLabelsNobl9 featuresSLO annotationsNobl9 featuresSLI aggregationsSLO guidesReplayNobl9 featuresAlertingAlertingYAML guideSLOs as codeSLO managementSLO guides