Alert details
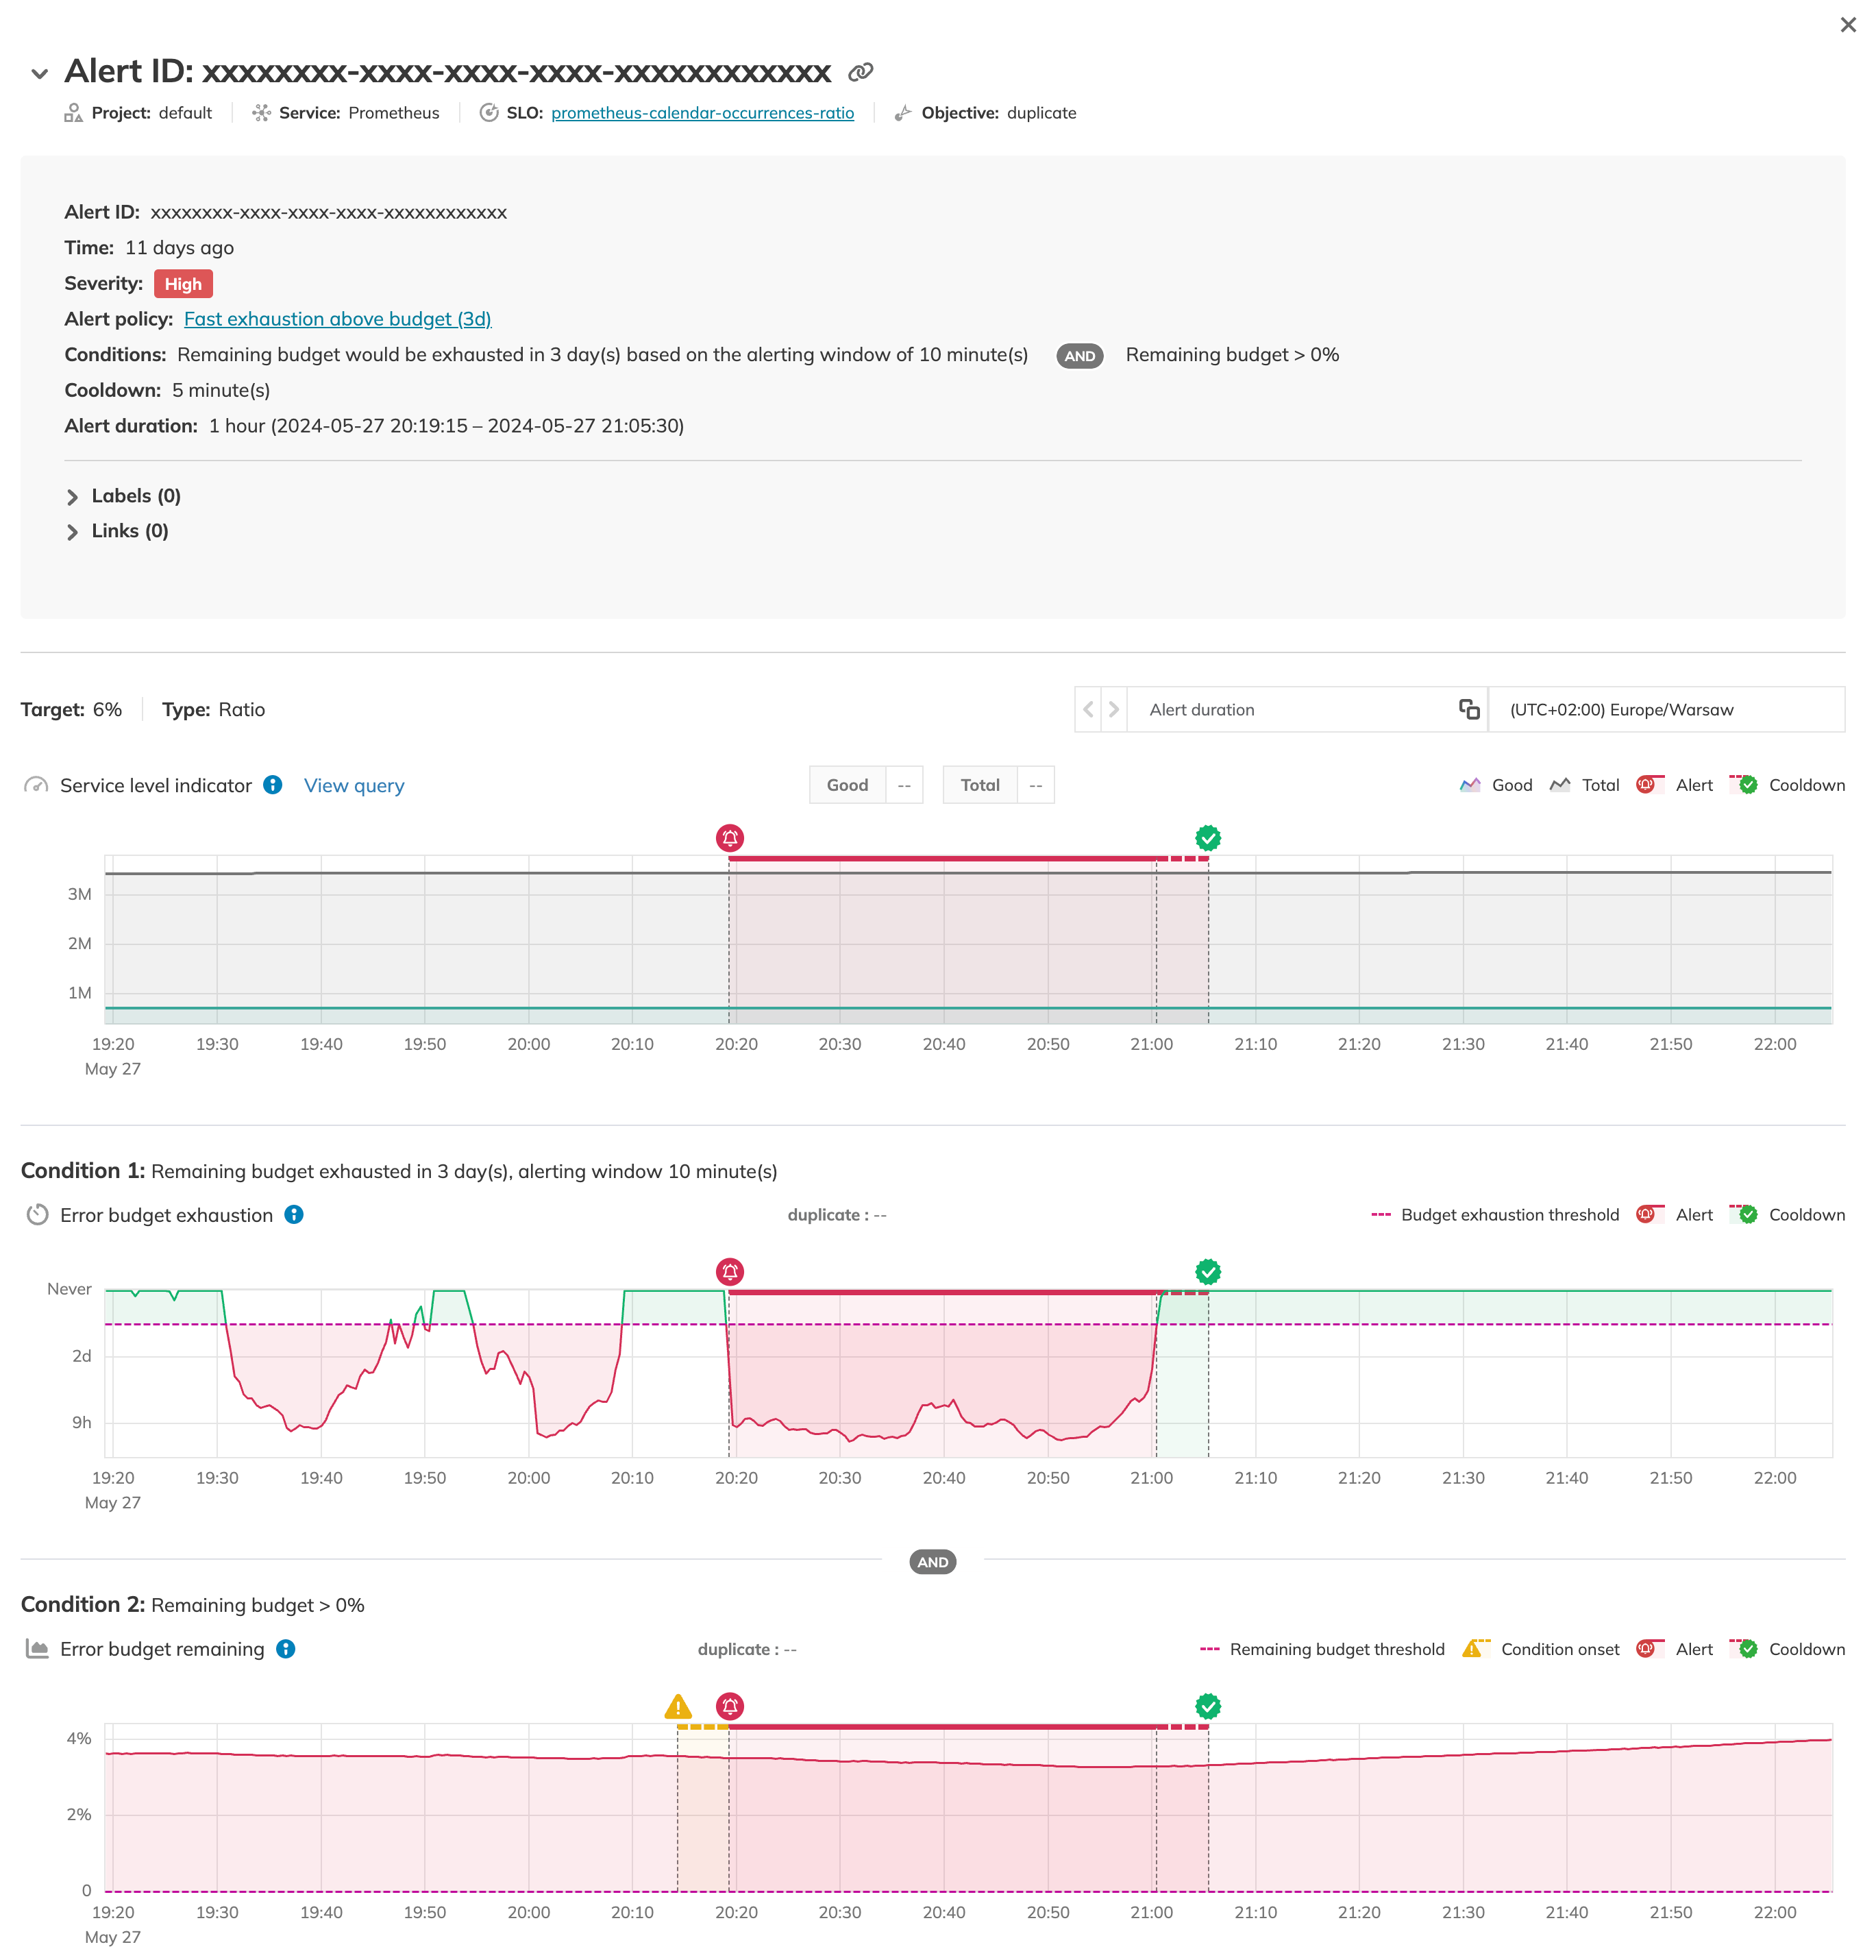
The alert details view provides an in-depth analysis of a particular triggered alert. This page offers a comprehensive overview of the alert's trigger timeframe, displaying the alert's duration on the SLI chart and on charts for every condition in the alert policy that was met. On the condition-specific charts, you can also see the exact moment the conditions were met and the reason for it.
Once an alert is triggered, Nobl9 adds a system annotation of the Alert type to the affected SLO charts. This annotation also becomes available in the Events section.
You can access alert details from the Alerts tab on the SLO details view. To do this, click the required alert in the list.
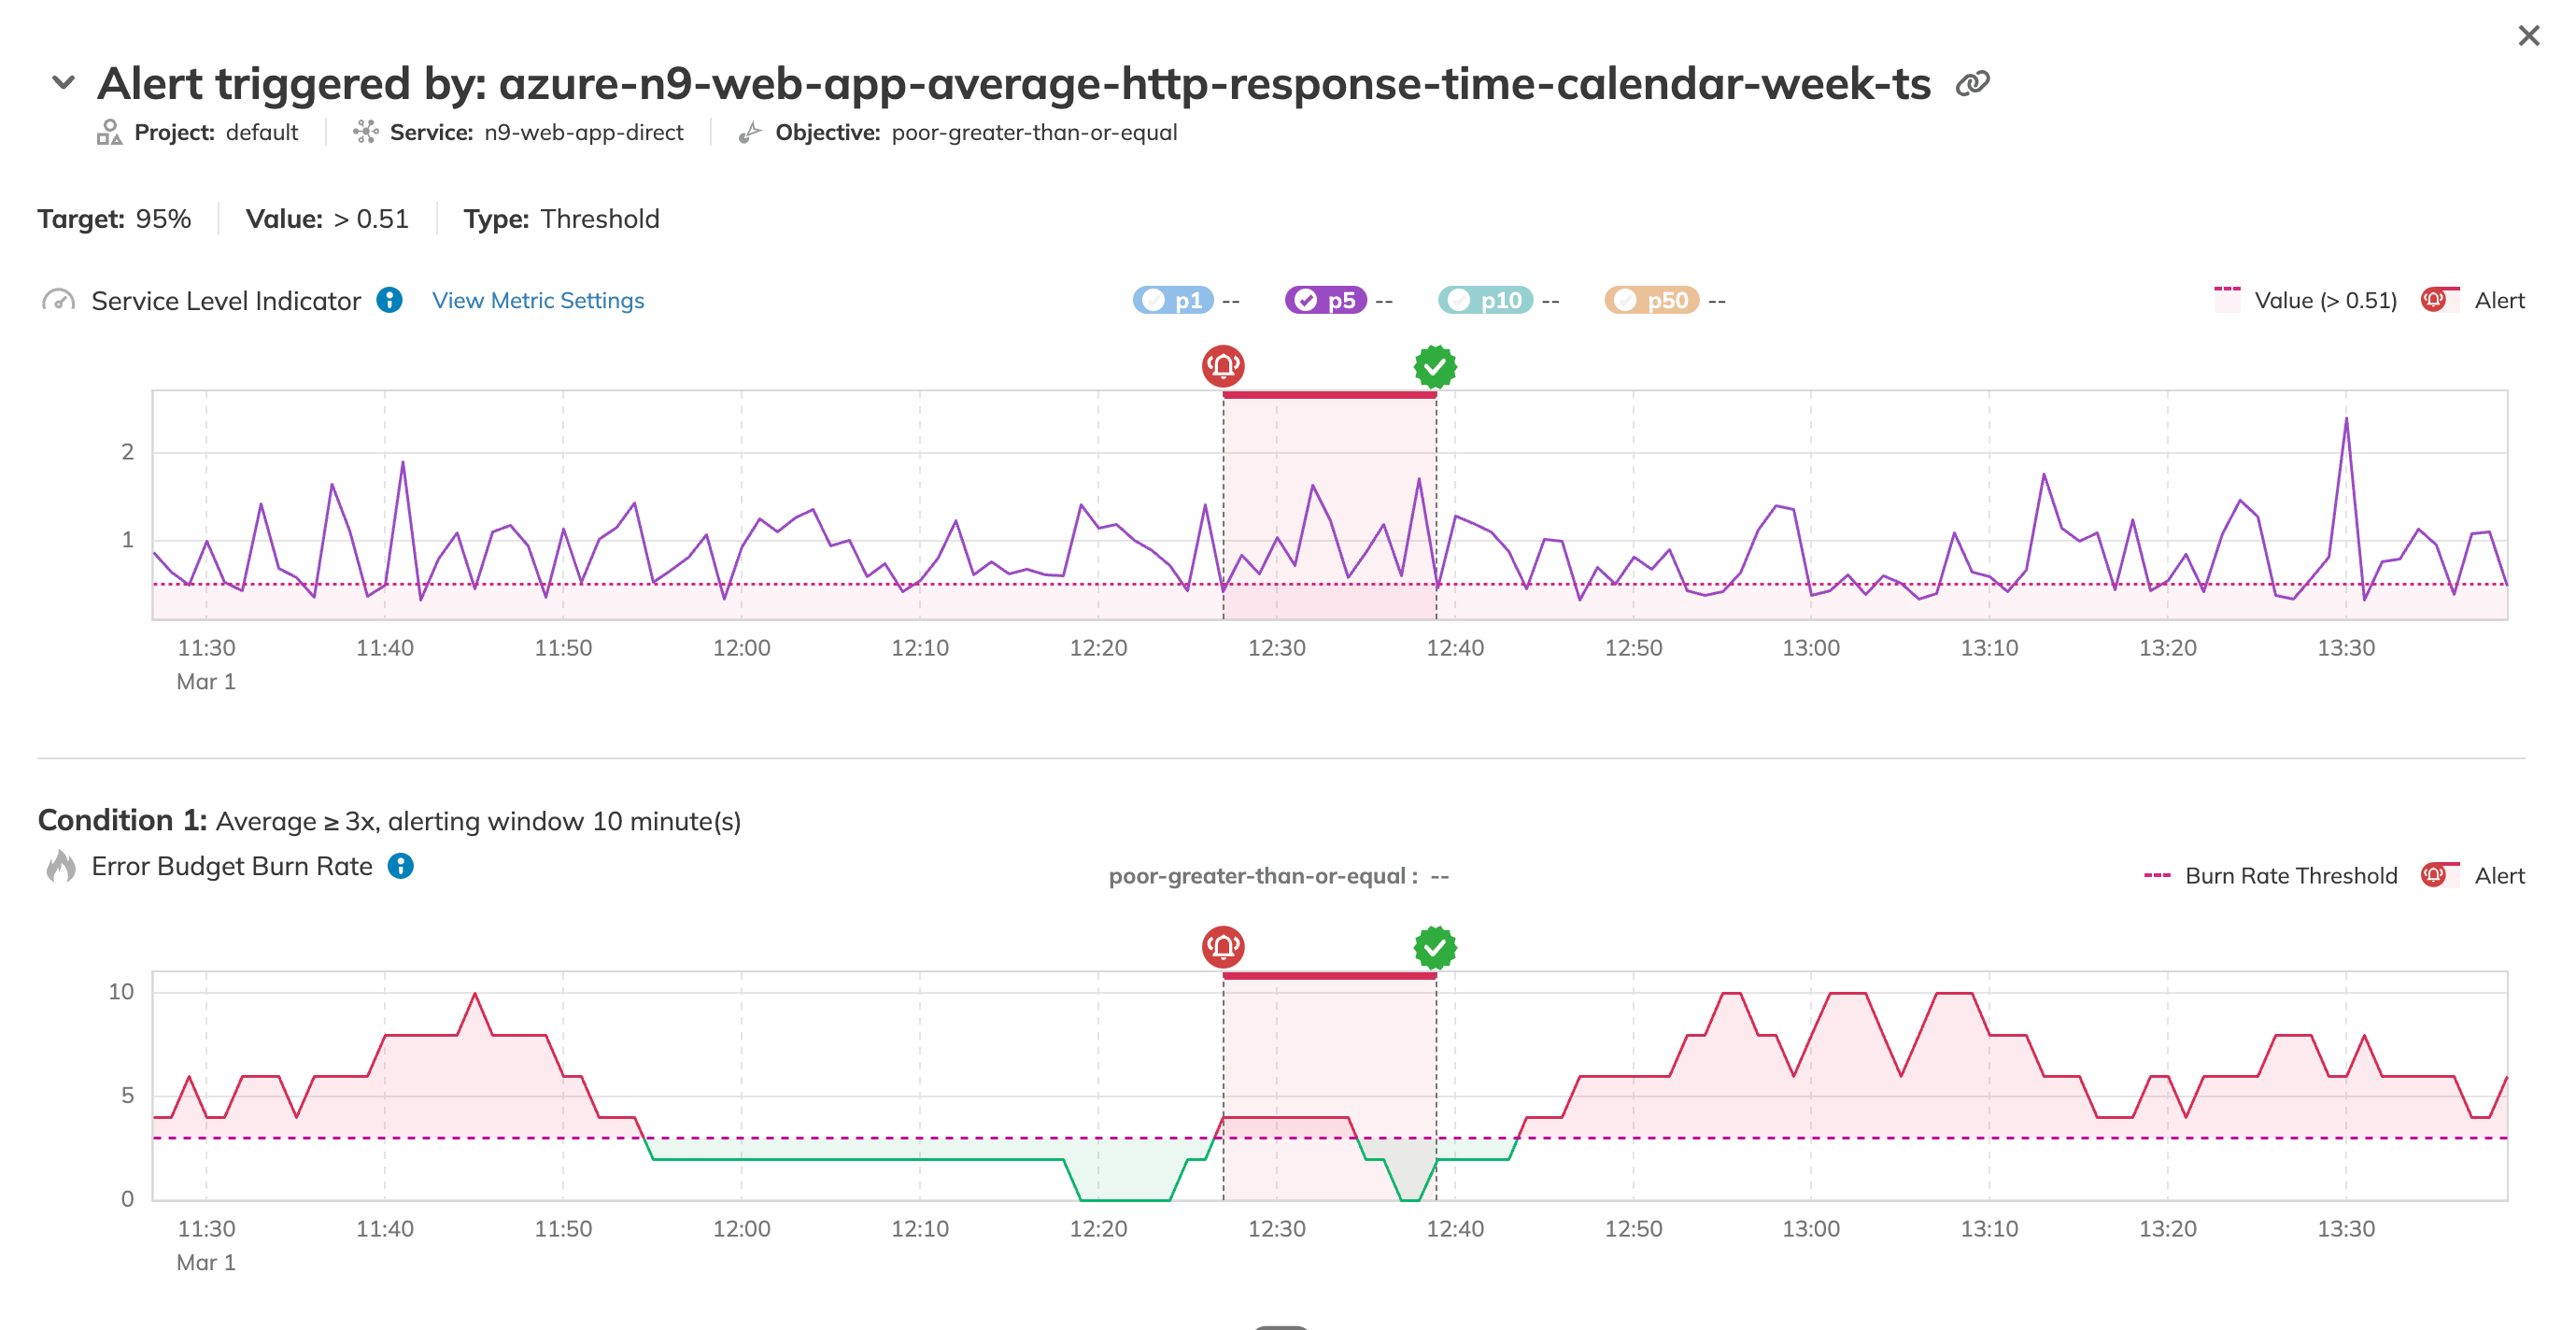
The yellow Alert condition onset interval highlights the period from when an alert condition first begins until the alert is triggered.
This period starts with the first data point that exceeds the threshold during the alert evaluation window. This feature is available for alerts that use either the alerting window or lasts for condition types.
An alert's onset period will not begin until a previous alert from the same policy is resolved.
Alert onset starts when the following conditions persist for the entire duration of the previous alert's cooldown period:
- The new alert's condition is fulfilled (
TRUE). - At least one condition of the previous alert is no longer met (
FALSE).
This can lead to a delay: an alert's condition may be met, but the onset period is blocked by the previous alert.
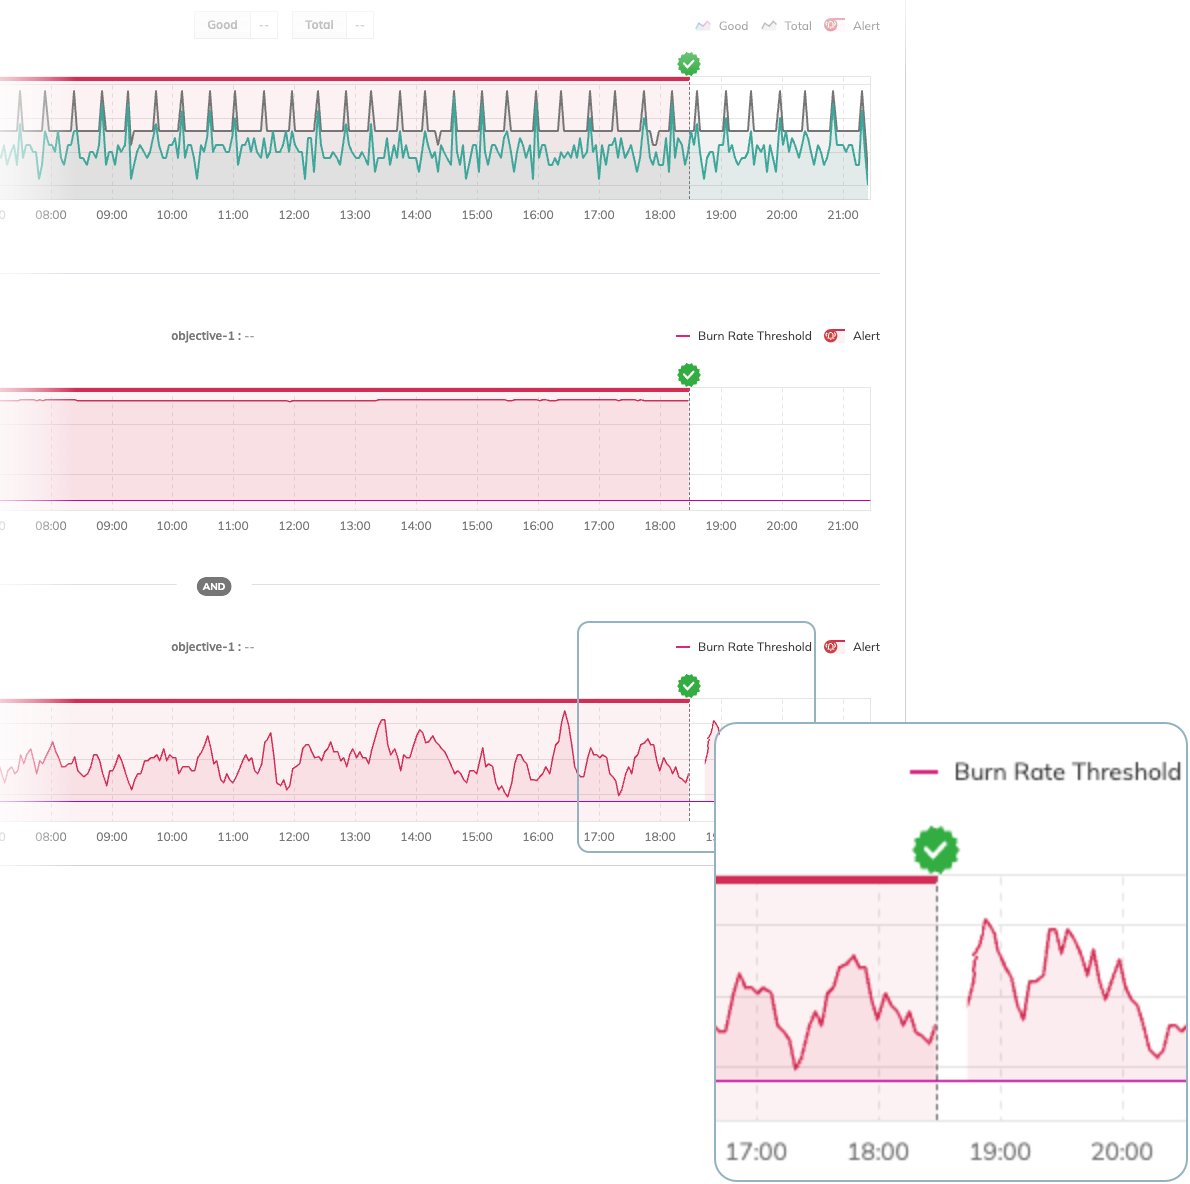
The green Cooldown interval indicates the alert's cooldown timer. This timer starts after the conditions triggering the alert are no longer met. The alert resolves if none of those conditions are met again during the cooldown period.
The table below shows an overview of charts displayed in the alert details view per condition and parameter type:
| Alerting condition type | Alerting window | Lasts for |
|---|---|---|
| Average burn rate is |  | |
| Entire budget would be exhausted | | |
| Remaining budget would be exhausted | | |
| Remaining budget is |  | |
Metadata
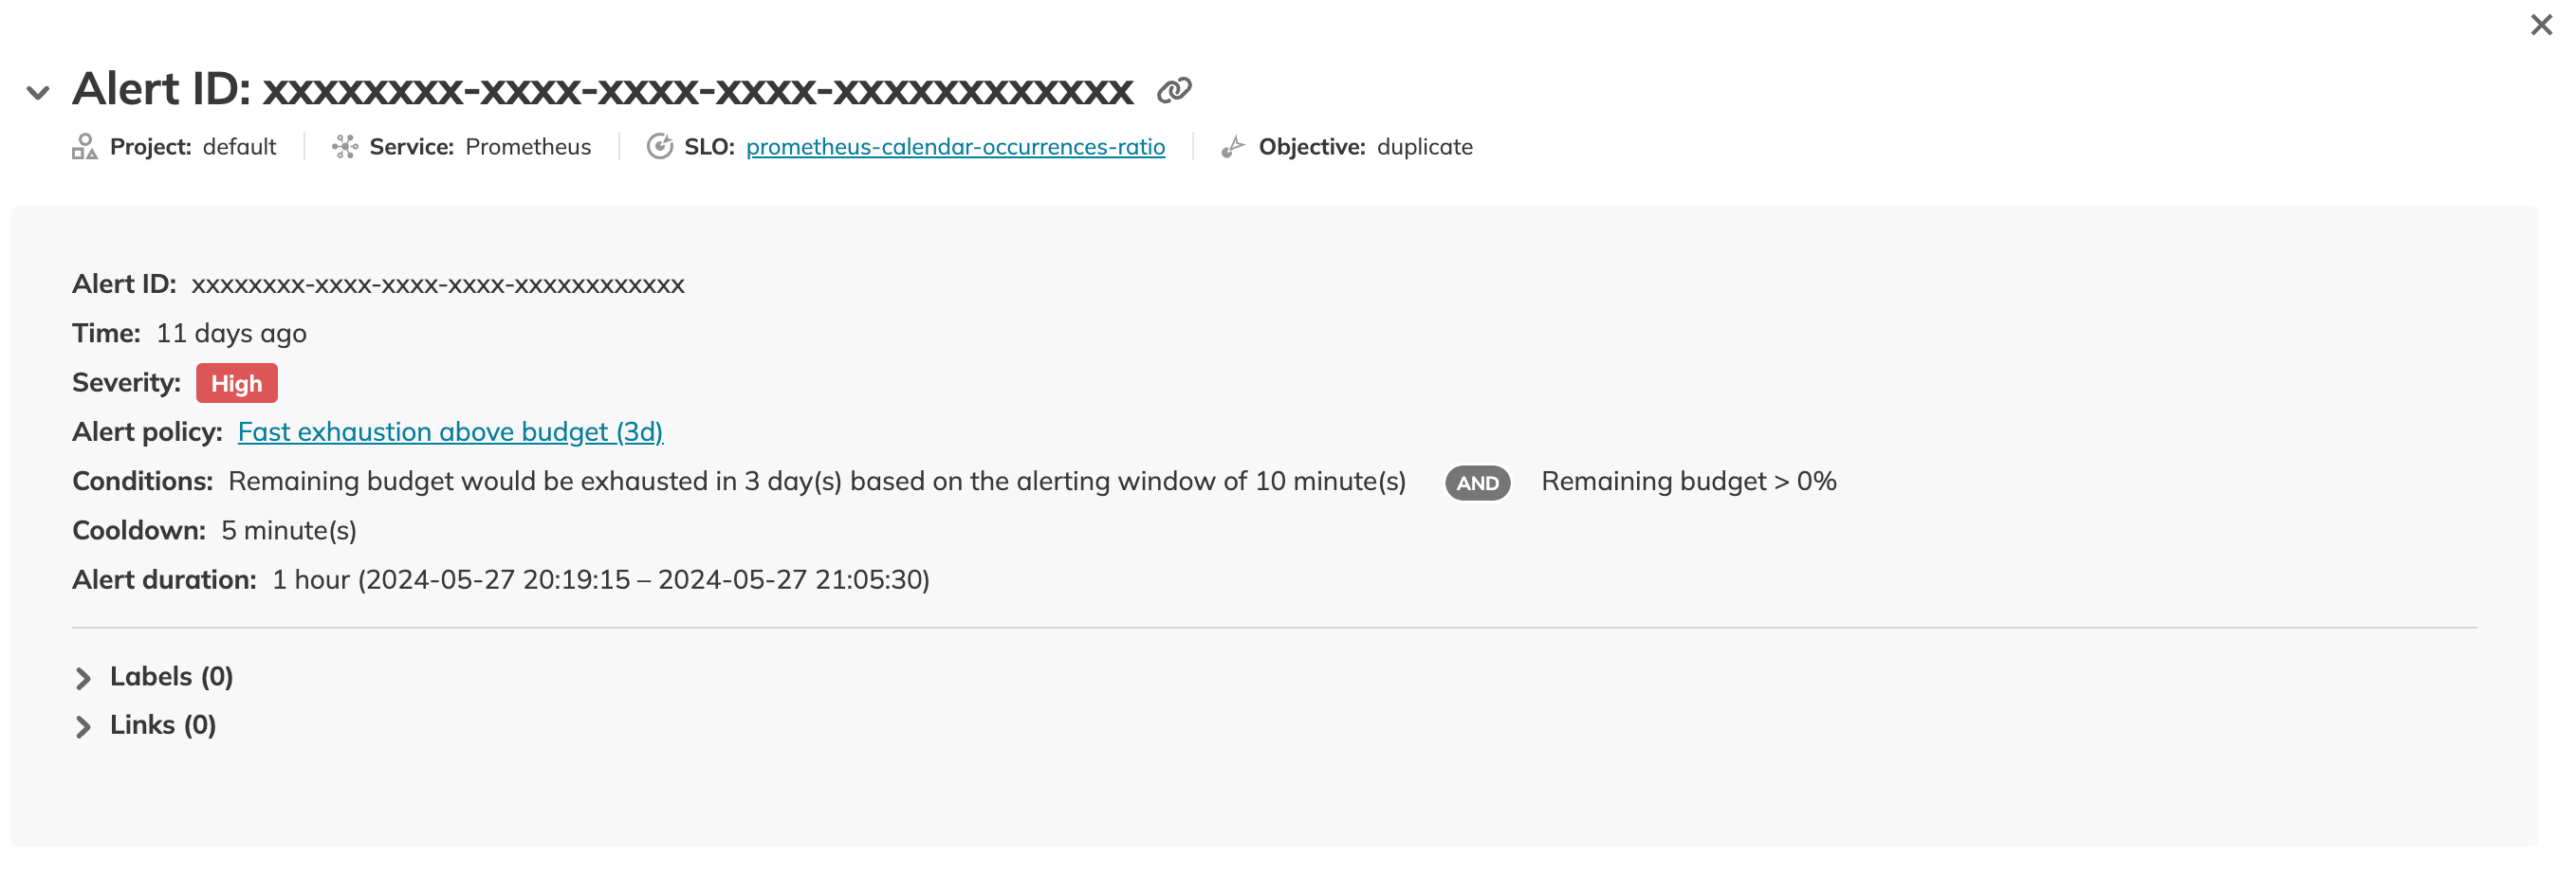
The metadata block under the alert ID provides essential information about the alert:
- Alert ID
- Affected SLO summary—project, service, SLO name, and the affected objective
- Time when it was triggered
- Alert policy info—name, severity, conditions, and the cooldown period
- Alert duration
- Silence time range, if the alert was triggered during a silence period
Charts
- The alert details page displays information about one particular alert.
- The dotted line indicating the alert is an approximation.
- If the threshold value is changed, the change will not be reflected in existing alerts.
Alert details display the value from the moment the alert was triggered. - Alert details do not auto-refresh.
To view the latest alert details, refresh the page.
Breaks in chart continuity
You may notice gaps in the alerting charts. This happens because chart data can only be displayed after Nobl9 has processed the data for a complete alerting window. Therefore, the processing requires a duration at least as long as the alerting window itself.
For example, if you set the alerting window to 1 hour, Nobl9 needs at least 1 hour of data points to process the evaluation.
This behavior typically occurs with calendar-aligned SLOs, especially if they have alert policies with long alerting windows. When a new time window begins, a gap appears in the chart. This gap signifies the start of a new data processing cycle, which lasts for the duration of the configured alerting window.
For rolling SLOs, this happens only at the beginning of the SLO's lifecycle as it gathers initial data. After this initial period, the error budget calculation rolls forward and does not reset. This ensures that the data used for alerting is continuous and uninterrupted.
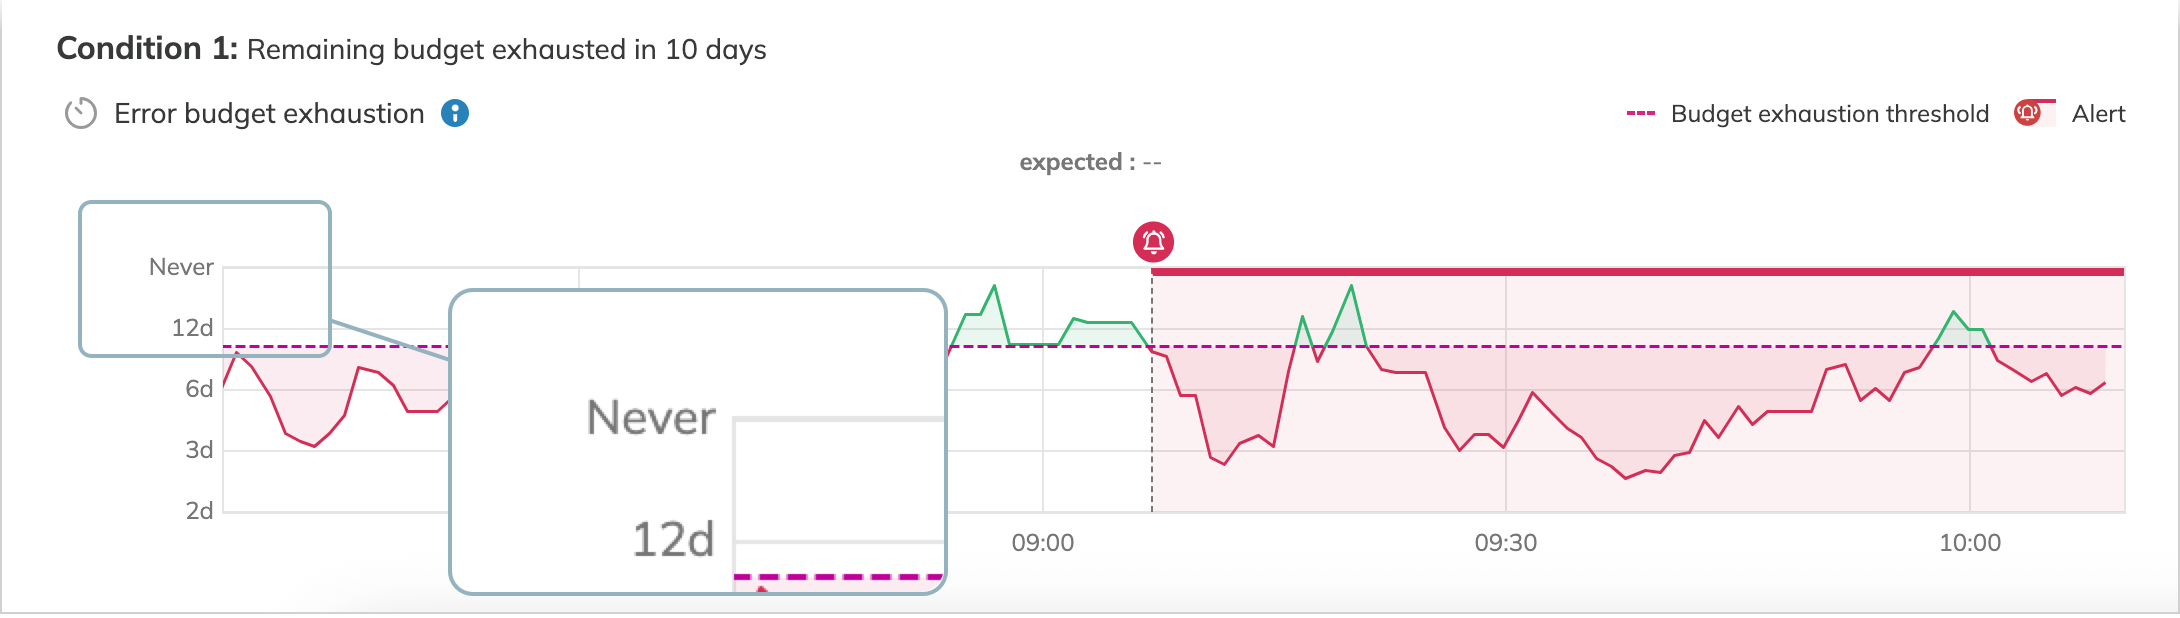
Error budget exhaustion charts
The Error budget exhaustion chart provides the following information:
- x-axis—a timeline of the SLO's performance
- y-axis—a time-based prediction of when the SLO will completely exhaust its error budget. This prediction is based on the conditions defined in the alert policy.
The y-axis can display the following two extrema:
- Never indicates that based on the current rate of consumption, the SLO is not predicted to exhaust its error budget within the SLO's time window.
- 0 indicates that your SLO has exhausted its entire budget.
Impact of Replay
When a Replay is active, Nobl9 temporarily pauses alert calculations.
For example, if a 20-minute Replay starts at 12:00, the charts will not show any data past 12:00 until the process is complete. To see updated charts, wait for the Replay to finish. You can check its progress in the Job status widget.

