System Health Review report
The System Health Review report provides a simplified way to monitor and report on your system's reliability and performance. It's specifically designed for recurring reliability check-in meetings, giving you an efficient overview of your system health over time.
System Health Review is targeted at:
- System administrators monitoring day-to-day operations
- Technical managers tracking team performance
- Upper management making strategic decisions
The report presents SLO data in an easy-to-understand format that supports informed decision-making across all organizational levels.
Report overview
System Health Review is a table-formatted report.
It groups your Nobl9 SLOs by projects, services, and labels of your choice through the remaining error budget metric.
The report gives both aggregated and detailed views of the overall system health for SLOs residing in selected projects or services. The four color-coded categories reflect the available error budget of the SLOs:
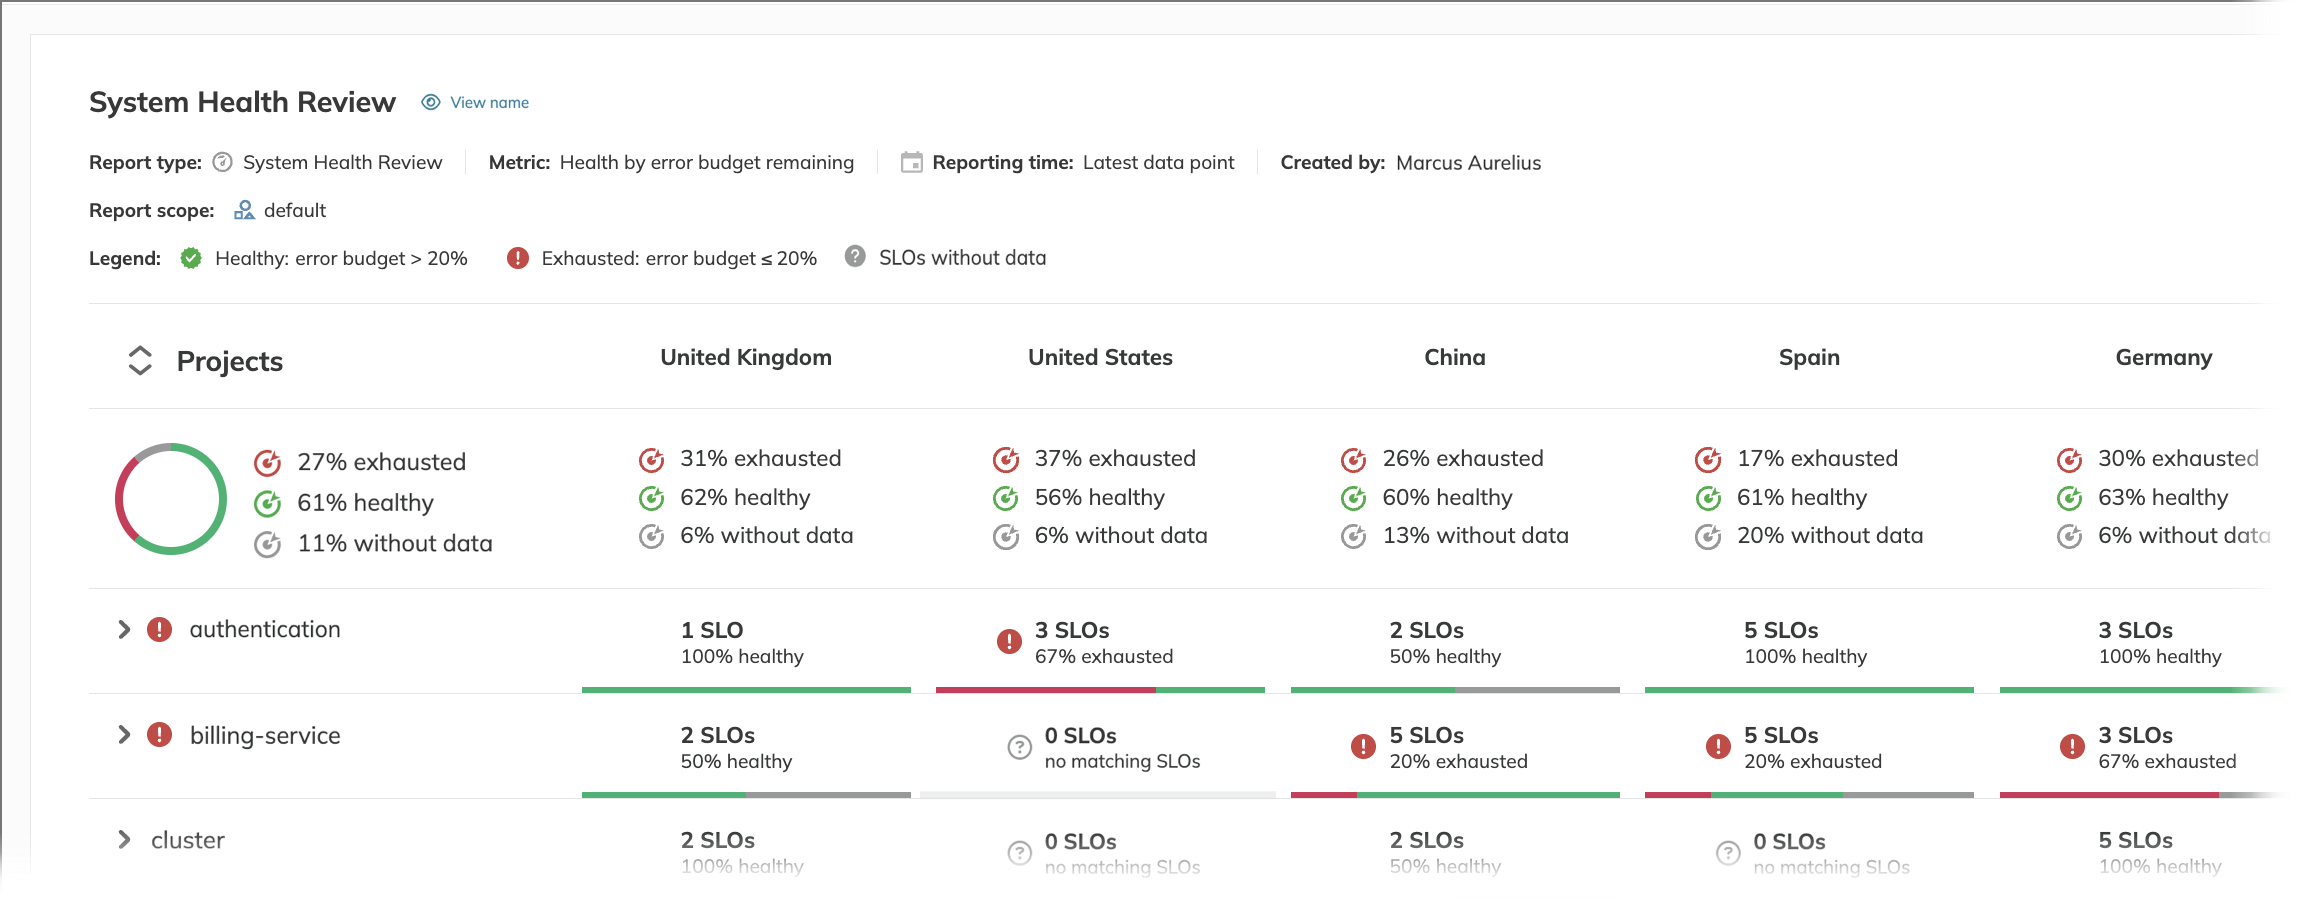
The report aggregates SLO health information to provide quick glimpses into the performance of your system.
Depending on the grouping option set for the report, the table rows display one of the following:
- Project rows—project names
- Service rows—service names
- Label value rows—label values
- Custom rows—row names you defined
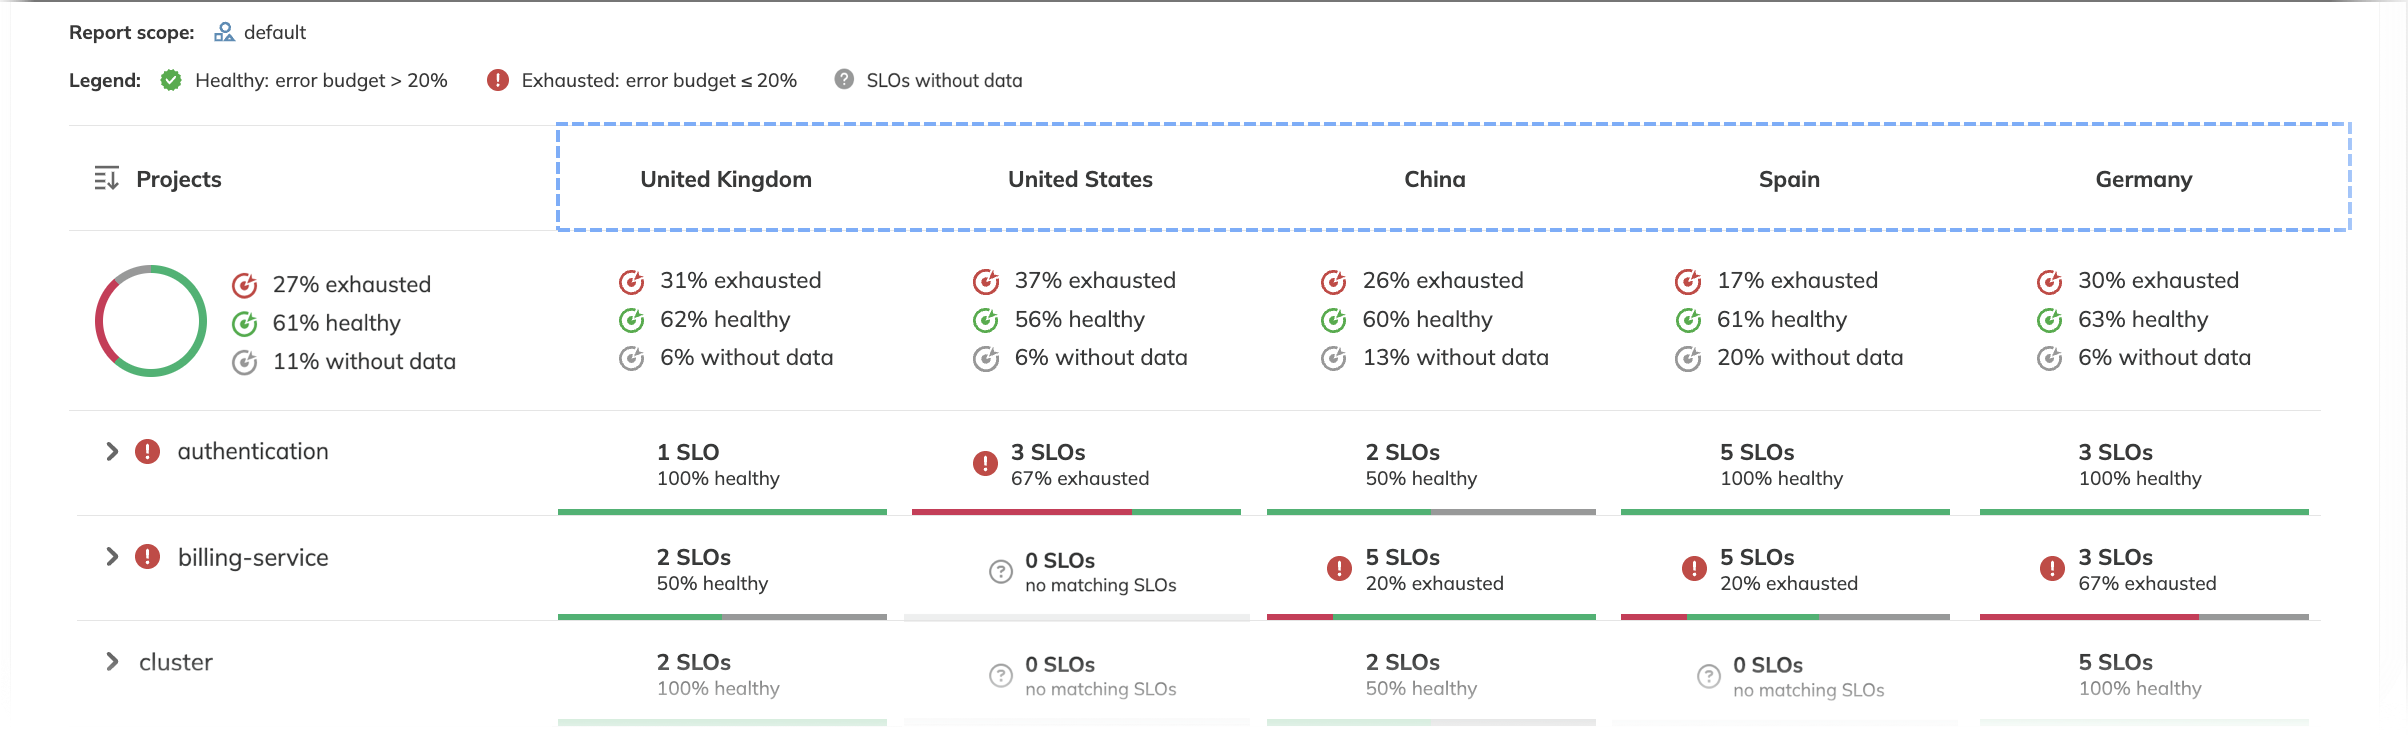
The top-right header cell displays the grouping indicator—Projects, Services, a selected label key, or a user-defined custom name.
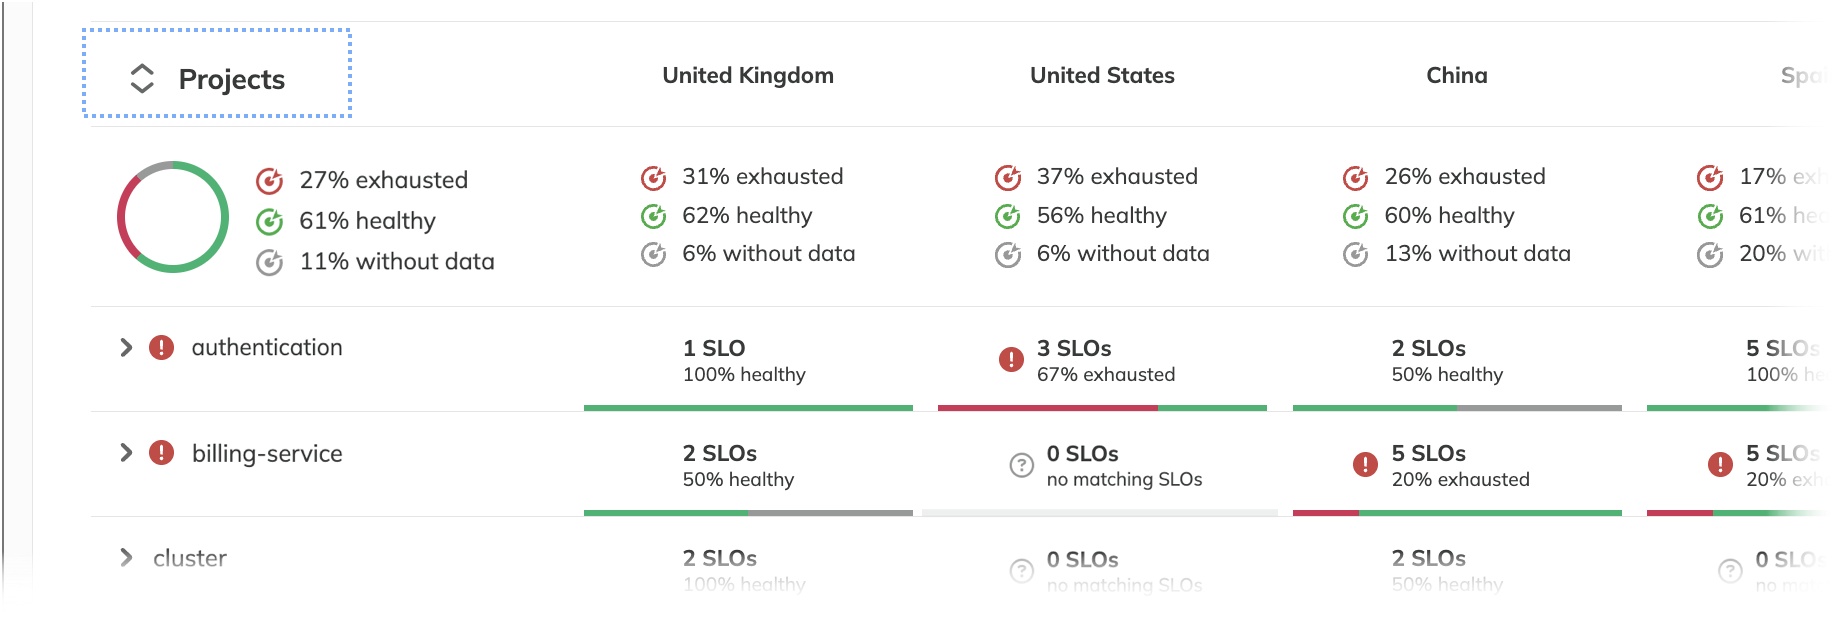
You can sort the table by SLO's remaining error budget. For this, click the required column header:
Aggregated columns and rows
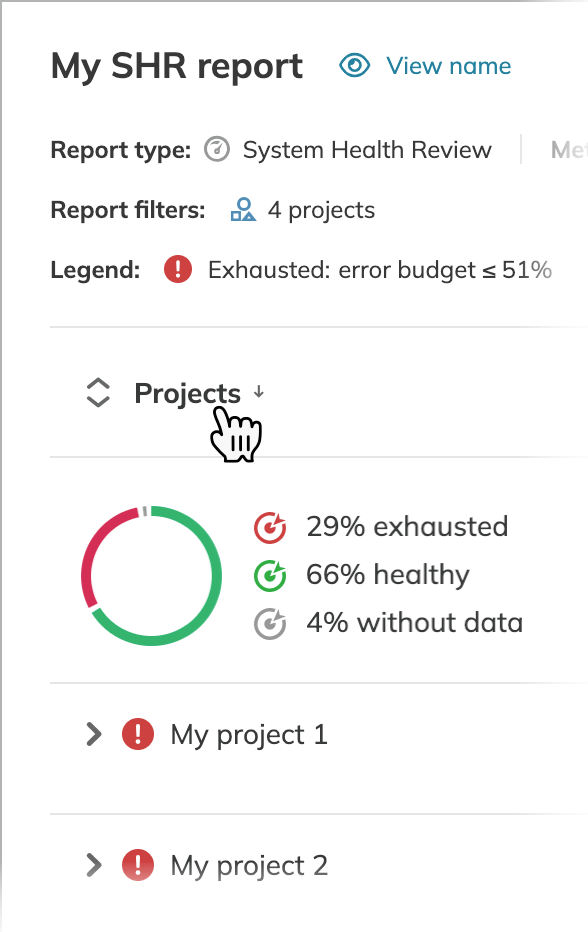
The report shows SLO health as percentages in each cell, with color-coded categories you define when creating the report:
- Healthy SLOs have sufficient error budget remaining
- At-risk SLOs have an error budget running low
- Exhausted SLOs have an error budget fully consumed
- No data SLOs have insufficient data for calculation
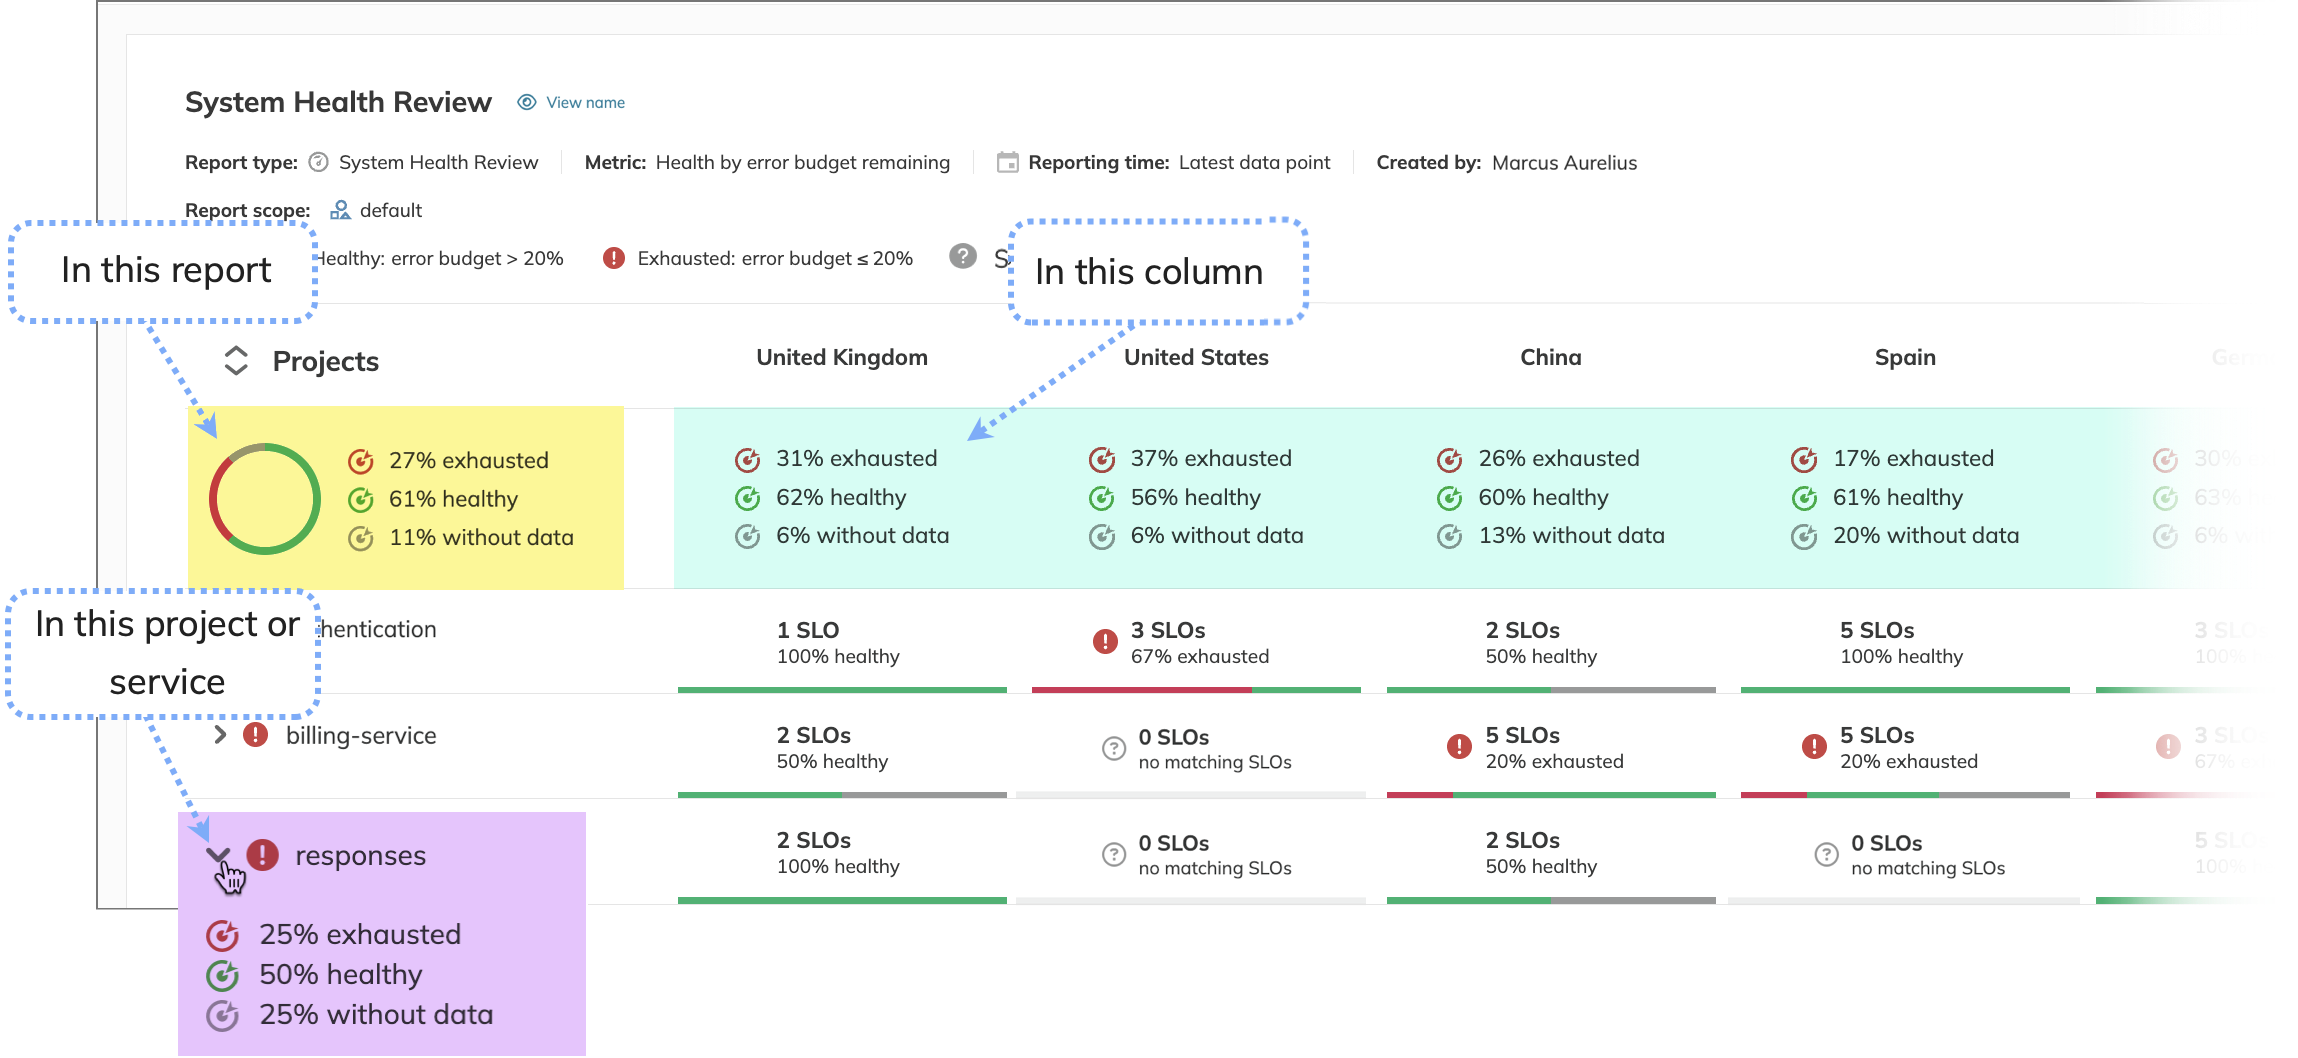
Four levels of aggregation:
- Overall (top-left cell) shows the health distribution across all SLOs in the report
- By row (right column) shows health distribution for all SLOs in a particular project / service / label
- By column (top row) shows health distribution for all SLOs matching that column's labels
- By cell (intersections) shows health distribution for all SLOs that fall into particular cells
View the example of aggregation levels
- In the entire report: 13% of all SLOs are exhausted, 26.1% are at risk, and 60.9% are healthy
- Team Operations on all environments: 12.5% exhausted SLOs, 23% at risk, and 62.5% healthy SLOs
- All teams on the staging environment: 50% exhausted SLOs, 0% at risk, and 50% healthy SLOs
- Team Operations on staging: 33% exhausted SLOs and 25% healthy SLOs
SLOs display logic
The report only displays SLOs pre-filtered in Step2: Filter resources. The further display logic depends on the layout configuration.
- Table cell display
SLOs displayed match both layout criteria—for rows and columns.- Tagged with the labels selected for each column, AND
- Satisfy the row filters:
- Reside in projects or services, OR
- Have the labels or label values as specified for the row grouping
- Label filtering logic for columns
When multiple labels are assigned to a column, Nobl9 applies the filter combination logic:- Same key, different values: SLOs must match ANY of the values (OR logic)
- Different keys: SLOs must match ALL keys (AND logic)
Example:
If a column has these labels:environment: stagingORenvironment: productionANDteam: operations, SLOs must have all label keys but can match either value.
I.e., SLOs will appear in this column if they have:environment: stagingANDteam: operations, ORenvironment: productionANDteam: operations
- Grouping in Label value rows configuration
SLOs with the specified labels are displayed in the report, where:- Columns are populated by selected full labels (key-value pairs)
- Rows are populated by a selected key, where all of its available values become the row headers
- The Ungrouped SLOs row appears when your report includes SLOs that match report filters and have column labels, but miss the label selected for row grouping
- The cells at the intersection of a column and a row contain the SLOs that match both the column's full label and the row's key value
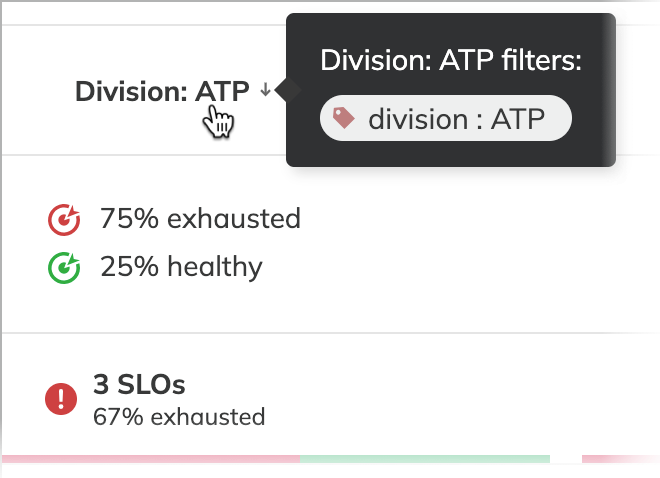
Column groupings - Grouping in Custom rows configuration
The table cells display SLOs that have the following labels:- Set for a column
- Set for a row
You can view labels assigned to columns and rows. For this, hover the cursor over the required column or row header cell:
From the perspective of the reporting time frame, the report can be:
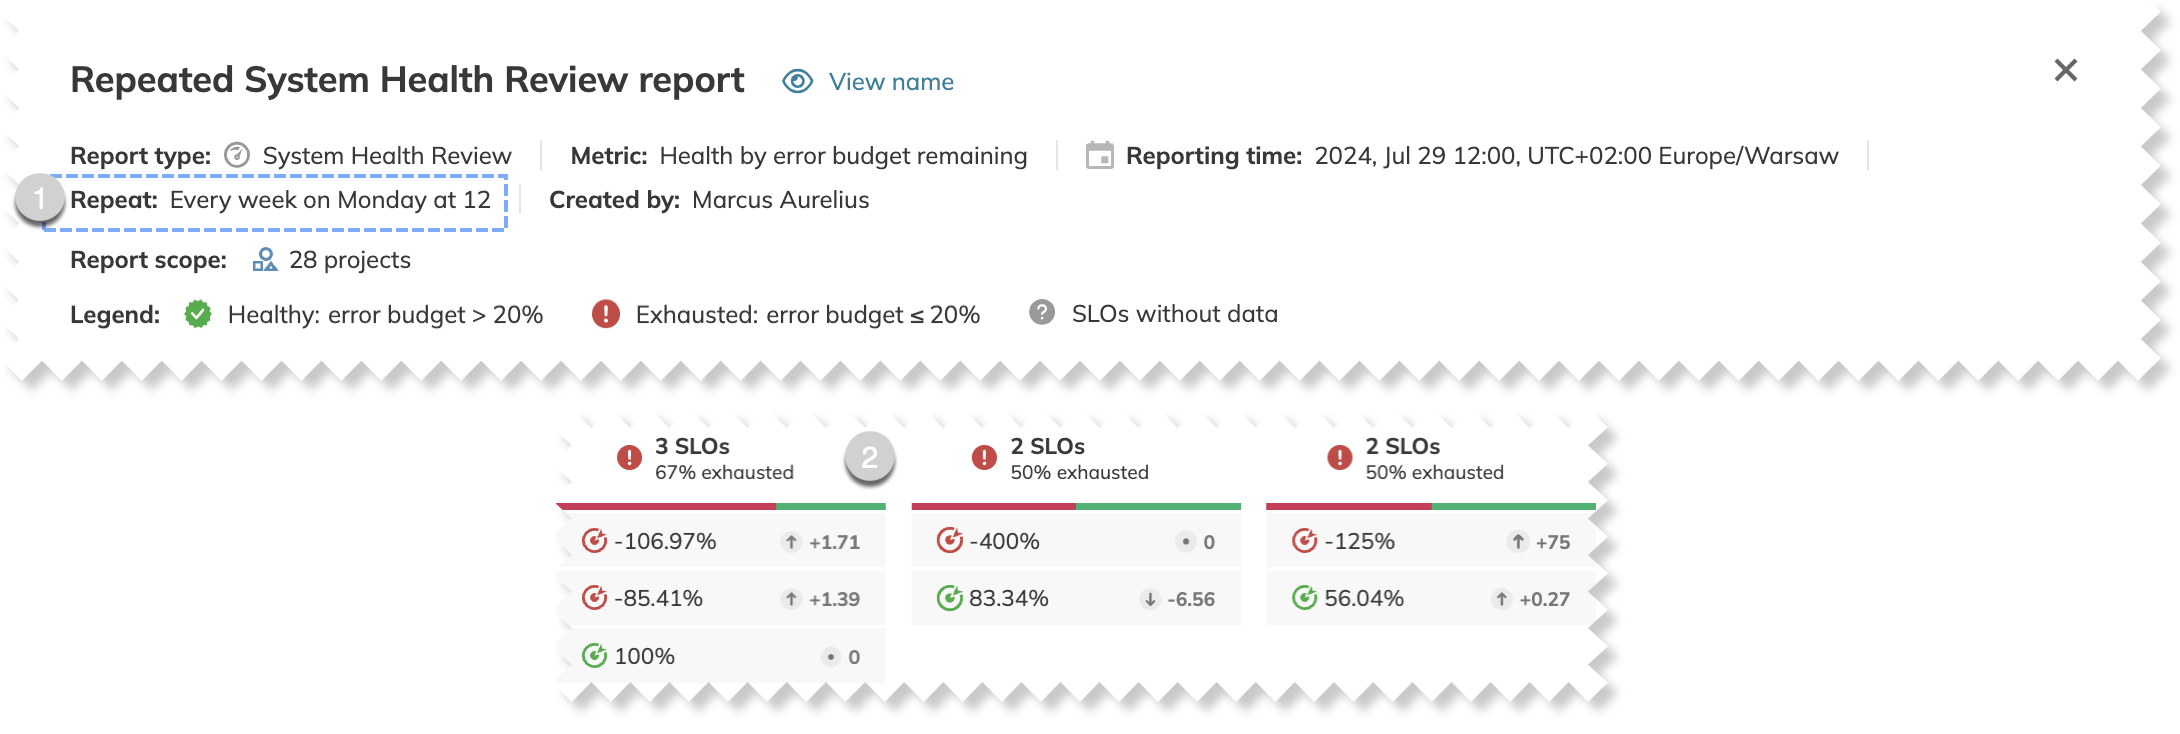
SLO health trends represent the remaining error budget metric trends for the latest reporting period.
For example, in reports generated every Monday (available with rrule), the trend will reflect the comparison between the previous and current Mondays.
Create a System Health Review report
You can create the System Health Review report on the Nobl9 Web or applying a YAML configuration in sloctl.
- Nobl9 Web
- YAML configuration for sloctl
- On the Nobl9 Web, go to Reports.
-
Click
 .
.
Step 1: Name report and choose its type
- Enter the display name for your report.
You can edit it at any time. - Select the System Health Review report type.
Step 2: Filter resources
The resources you select define the scope of your report.
- Select at least one project, service, or service level objective to be included in your report.
These fields are interdependent: selecting a project defines the list of available services and SLOs, and selected SLOs narrow down the list of available services and projects. - Optional: Select labels to add more resources to your report.
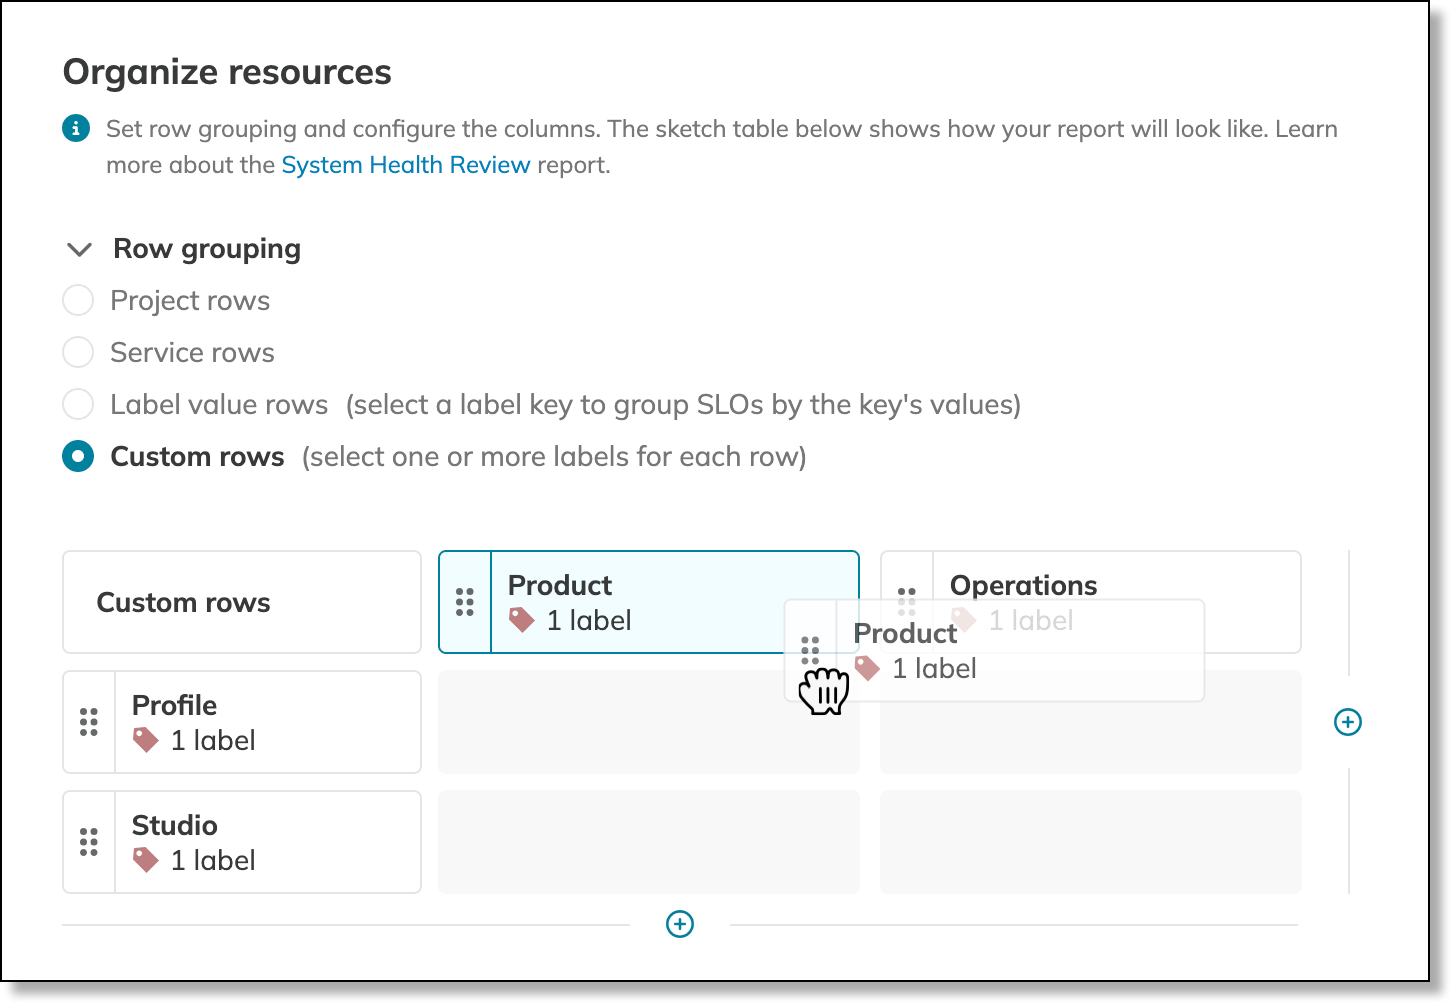
Step 3: Define report layout
Your report layout depends on the row grouping you choose and the columns you configure.
The table below shows the report structure preview—your actual data will appear once you complete the configuration.
- Set Row grouping to define the rows:
- Project rows displays project names in header rows and SLOs from these projects in cells
- Service rows displays service names in header rows and SLOs from these services in cells
- Label value rows displays the values of the selected label key in header rows and SLOs labeled with the correspondent key-value pair
- Custom rows displays the custom row names you define and SLOs tagged with the labels you selected for each row
- Configure table rows (for the Custom rows grouping) and columns:
- Enter the required row or column names and select labels for each
- To add rows / columns, click + at the bottom or on the right boundary of the table (up to 50 columns / 30 rows per report)
- To remove a row or column, hover over it and click
 that appears above the column or to the left of the row
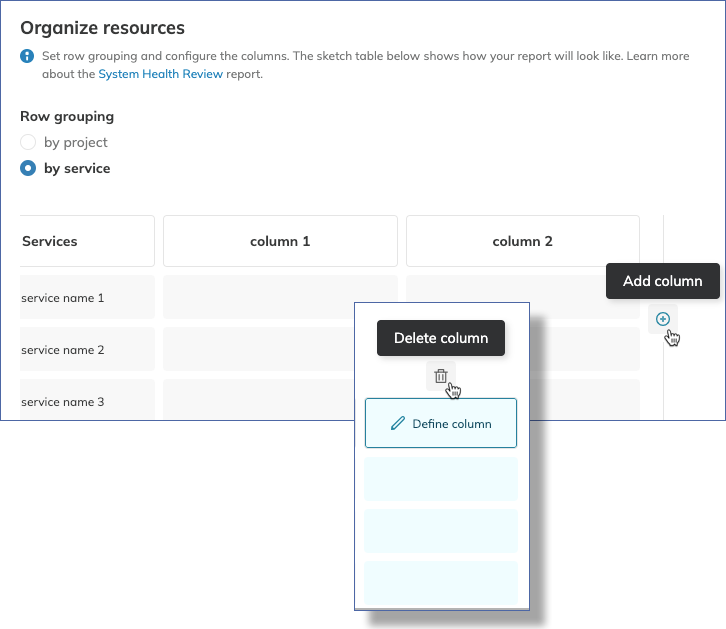
Adding and removing columns - Use drag and drop to organize rows (the Custom rows grouping) and columns
Organizing columns - With the Custom rows grouping option, you can also define a custom name for the top-right header cell. For this, double-click it and enter your required name.
Step 4: Configure thresholds
Thresholds define report categories: Exhausted, At risk, and Healthy.
- Specify how much of the SLOs' remaining error budget define exhausted and healthy SLOs.
- SLOs with the error budget remaining between these values fall into the At risk category.
- You can reset the thresholds to their default values set by your organization admin for the Service health dashboard.
- Set the visibility of the At risk category and SLOs that report no data.
- Hide At risk and set the same values for Exhausted and Healthy, so your report includes only two categories.
- Deselect SLOs without data to have these SLOs in your report.
Step 5: Select reporting time
You can create a one-time report based on the latest data or retrospective. Retrospective reports can be one-time or recurring.
To create the report based on the latest data, select Real-time and specify the time zone.
For Retrospective, do the following:
- Set the date, time, and time zone: your report will show the state of your selected SLOs as of the moment you specified.
- Specify the Repeat rule for your report:
- With any option except for Don't repeat, Nobl9 will update the report as frequently as you select.
- Select Custom when no repeat option fits your needs:
- Enter your custom recurrence rule in the iCalendar format or use the rrule generator.
- Omit specifying the date, time, and time zone in the rrule—you already have them set.
- The minimum recurrence frequency is
DAILY.
Apply the following YAML definition to create a System Health Review report:
apiVersion: n9/v1alpha
kind: Report
metadata:
  name: string # Mandatory
  displayName: string # Optional
spec:
  shared: true # Optional, boolean, defaults to false
  filters: # You must define at least one level of filtering from these three: projects, services, slos
    projects:
      - project-1 # Mandatory if filtering by projects
    services:
      - name: string # Mandatory if filtering by services
        project: string # Mandatory if filtering by services
    slos:
      - name: string # Mandatory if filtering by slos
        project: string # Mandatory if filtering by slos
    labels:
      "key_1":
        - "value_1"
        - "value_2"
      "key_2":
        - "value_1"
        - "value_2"
  systemHealthReview:
    timeFrame:
      snapshot:
        point: enum # Mandatory. One of: past | latest
        dateTime: YYYY-MM-DDThh:mm:ssZ # Mandatory if point.past is defined
        rrule: string # Recurrence rule definition. Use only if point.past is defined
      timeZone: "America/New_York" # Mandatory
    rowGroupBy: enum # Mandatory. One of: project | service | label | customRows
    columns:
    - displayName: string # Mandatory
      labels: # Mandatory
        "key_1":
          - "value_1"
          - "value_2"
        "key_2":
          - "value_1"
          - "value_2"
    - displayName: string # Mandatory
      labels: # Mandatory
        "key_3":
        - "value_1"
    thresholds:
      redLte: float # Mandatory
      greenGt: float # Mandatory
      showNoData: false # Optional, boolean
View examples: project and label value grouping
- apiVersion: n9/v1alpha
  kind: Report
  metadata:
    name: shr-report
    displayName: System Health Review
  spec:
    shared: true
    filters:
      projects:
        - project-1
        - project-2
    systemHealthReview:
      timeFrame:
        snapshot:
          point: past
          dateTime: 2024-07-01T10:00:00Z
          rrule: FREQ=WEEKLY
        timeZone: Europe/Warsaw
      rowGroupBy: project
      columns:
        - displayName: Column 1
          labels:
            key1:
              - value1
            key2:
              - value2
              - value3
      thresholds:
        redLte: 0.8
        greenGt: 0.95
        showNoData: false
- apiVersion: n9/v1alpha
  kind: Report
  metadata:
    name: shr-report
    displayName: System Health Review
  spec:
    shared: true
    filters:
      projects:
        - project-1
        - project-2
    systemHealthReview:
      timeFrame:
        snapshot:
          point: past
          dateTime: 2024-07-01T10:00:00Z
          rrule: FREQ=WEEKLY
        timeZone: Europe/Warsaw
      rowGroupBy: label
      columns:
        - displayName: US East
          labels:
            region:
              - us-east
        - displayName: US West
          labels:
            region:
              - us-west
      labelRows:
        - labels:
            env: []
      thresholds:
        redLte: 0.8
        greenGt: 0.95
        showNoData: false
apiVersion: n9/v1alpha
kind: Report
metadata:
  name: shr-report
  displayName: System Health Review
spec:
  shared: true
  filters:
    projects:
      - project-1
      - project-2
  systemHealthReview:
    timeFrame:
      snapshot:
        point: past
        dateTime: 2024-07-01T10:00:00Z
        rrule: FREQ=WEEKLY
      timeZone: Europe/Warsaw
    rowGroupBy: customRows
    columns:
      - displayName: Team Orange
        labels:
          team:
            - orange
      - displayName: On-calls
        labels:
          team:
            - on-call-1
            - on-call-2
    labelRows:
      - displayName: Production and Development on us-east
        labels:
          env:
            - prod
            - dev
          region:
            - us-east
      - displayName: Staging (all regions)
        labels:
          env:
            - staging
    thresholds:
      redLte: 0.8
      greenGt: 0.95
      showNoData: false
    tableHeader: Environment
- When defining resources for
filters, you must also specify the resource that contains them. For example, to add a service, you must define the project containing that service underfilters.project
spec objects to see detailed descriptions:metadataspecspec.filtersspec.filters.projectScopespec.filters.projectsspec.filters.servicesspec.filters.slosspec.filters.labelsspec.systemHealthReviewspec.systemHealthReview.timeframemetadata.namemetadata.displayNamespec.sharedfalse.spec.filtersprojectScope: all, projects, services, or slos.filters.projectScopeselected. Use all to include all current and future projects the viewer can access. This option requires organization-wide project access. One of: selected | all.filters.projects[n]filters.services[n]filters.services[n].namefilters.services[n].projectfilters.slos[n]filters.slos[n].namefilters.slos[n].projectfilters.labelsspec.systemHealthReviewsnapshot.pointlatestshows data from the last received data point within the last hour.pastshows data for a specific, user-defined point in the past.
snapshot.dateTimepoint is past.snapshot.rrulepoint is set to past.snapshot.timeZoneAmerica/New_York).systemHealthReview.rowGroupByproject—groups rows by project.service—groups rows by service.label—groups rows by the values of a specific label key. Requires defining the label key insystemHealthReview.labelRows.customRows—creates custom rows defined by specific labels. Requires defining each row insystemHealthReview.labelRows[n].
systemHealthReview.columns[n]columns[n].displayNamecolumns[n].labelsOR operator, while labels with different keys are combined using an AND operator.systemHealthReview.labelRows[n]rowGroupBy is set to customRows. A maximum of 50 rows can be defined.labelRows[n].displayNamelabelRows[n].labelsOR operator, while labels with different keys are combined using an AND operator.systemHealthReview.labelRowsrowGroupBy is set to label. The value should be an empty array; it will be populated automatically with the values of the specified label key.systemHealthReview.thresholdsredLte and greenGt to the same value.thresholds.redLtethresholds.greenGtthresholds.showNoDatatrue, SLOs that have not reported any data will be included in the report. Defaults to false. Note: This does not affect resources that have no matching SLOs.systemHealthReview.tableHeaderUsing spec.rrule, you can create a rule for a System Health Report events that will generate them regularly. The spec.rrule field follows the iCalendar specification.
The format of the rrule field consists of key-value pairs separated by semicolons (;). Each key-value pair specifies a parameter of the recurrence rule. Nobl9 supports all iCalendar rules outlined in the iCalendar documentation.
Example:
apiVersion: n9/v1alpha
kind: Report
...
spec:
serviceHealthReport:
timeFrame:
snapshot:
point: past
rrule: FREQ=WEEKLY;BYDAY=MO;BYHOUR=10;BYMINUTE=0;BYSECOND=0
rrule generator to create a recurrence rule suited to your needs.Key points to consider
The behavior of your report is determined by the row grouping option you select. The following tables provide the summary of what to expect with each choice.
Table: Row configuration
| Grouping option | Configuration | Description |
|---|---|---|
| Project rows Service rows | Automatic | Rows are automatically added and populated based on the projects or services you select. The rows are sorted alphabetically by project or service name. |
| Label value rows | Automatic | Rows are automatically added and populated based on the values of your chosen label key. The rows are sorted alphabetically by value. |
| Custom rows | Manual | Rows are defined by you. You can add as many rows as you need, assigning a custom name and one or more labels to each. |
Table: No matching SLOs display
| Grouping option | Reason for no matching SLOs |
|---|---|
| Project rows Service rows | There are no SLOs in the project or service (defined by the row) that also have the labels selected for the column. |
| Label value rows Custom rows | There are no SLOs with the label(s) for that row that also have the labels selected for the intersecting column. |
Dynamic report updates
All reports are updated dynamically in response to the following triggers:
- Deleting projects, services, or labels
- Adding or removing labels from resources
- Moving SLOs
- Adjusting SLOs' error budgets or replaying SLOs
Table: System limits and capabilities
| Condition | Limit/Behavior | Description |
|---|---|---|
| Maximum rows | 50 | Maximum number of rows allowed for the Custom rows grouping option |
| Maximum columns | 30 | Maximum number of columns allowed per report |
| Historical data retention | 2 years | Maximum historical data available for retrospective reports |
| Minimum report frequency | Daily | Most frequent schedule allowed for recurring reports |
| Empty content | Not displayed | Projects or services containing no SLOs are automatically excluded from display |
If any of your SLOs use a data source with an extended query delay, "latest" type reports will show your system's state delayed by the configured query delay period.

