Composite SLOs
While standard SLOs are used to monitor individual components of your system, composite SLOs allow you to assess the reliability of the entire ecosystem. They provide a holistic view, from the big picture down to the individual components, helping you understand how the reliability of your system depends on its constituent parts.
Nobl9's composite SLOs offer a comprehensive solution for monitoring complex systems. You can combine SLOs from various data sources and projects into a multi-level structure, reflecting the hierarchy of your services. By assigning weights to each component, you can prioritize critical services and quickly identify which ones require the most attention.
With composite SLOs, you can build a flexible monitoring structure that can track everything from hardware performance to user journeys, all by combining existing SLOs.
Key features of composite SLOs:
- Combine SLOs from different data sources and projects and use SLOs as SLIs.
- Create a multi-level hierarchy with a unified composite objective and up to 20 components per level.
- Define how component data is consolidated using a specific aggregation metric.
- Assign component weights to control their impact on the composite error budget.
- Visualize each component's contribution in the Component impact graph.
- Preserve the error budget if any of the components is modified.
- Handle missing data from a component.
Composite details interface
Your composite SLO details page uses a tabbed layout, similar to a standard SLO. It includes the same Alerts, Change history, and Annotations tabs, but features a different Overview tab and the Structure tab instead of Objectives.
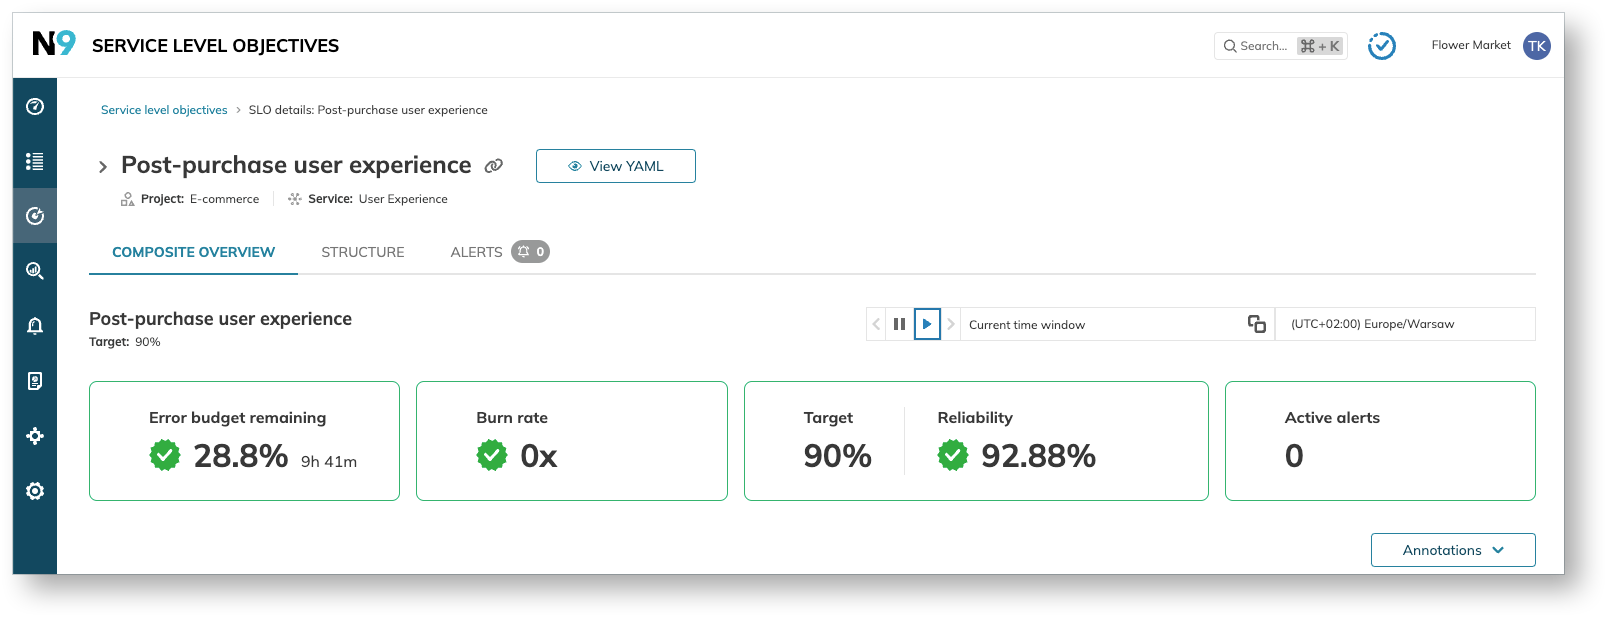
When you open a composite SLO, you land on the Overview tab, which displays information about the composite's performance within the selected time window.
Overview
The composite's overview includes the same tiles, options, and charts as a standard SLO, but all the information pertains to the composite objective.
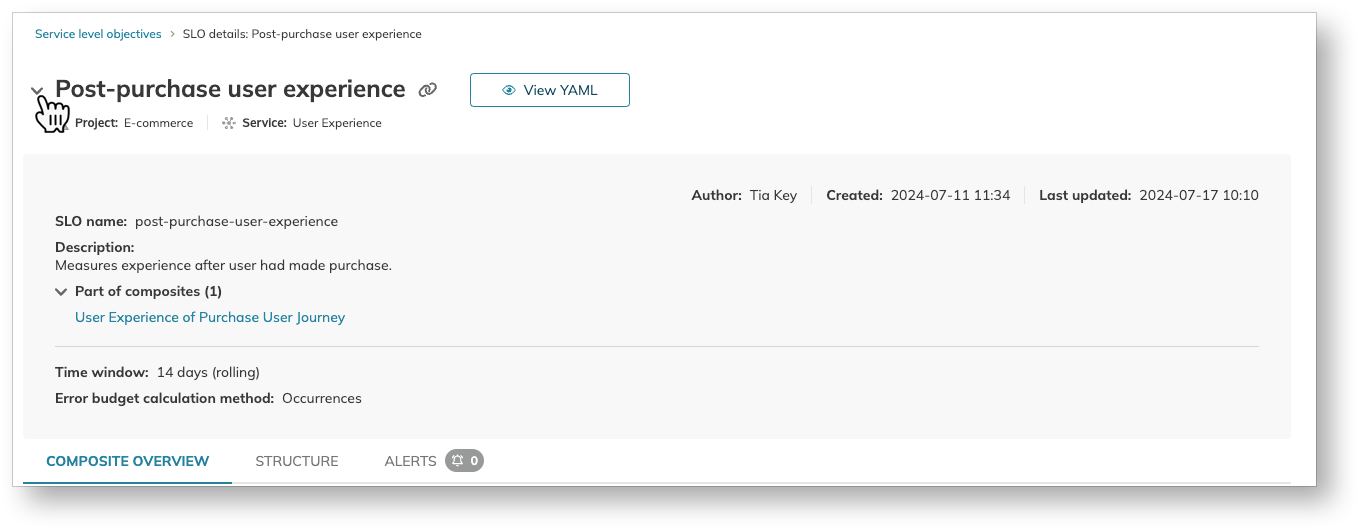
You can expand the metadata block to view the composite's metadata:
- The Attributes and definition block includes the name, the list of other composite SLOs if this is included in any, who created this SLO, when it was created and updated, and the names of users responsible for SLOs in this service.
- The Configuration block with the aggregation metric selected, time window, budgeting method, and delayed data handling option.
- The Review summary displays the review status and due date, if any.
Below the tiles, the Error budget remaining, Reliability burn down, and Error budget burn rate charts visualize the objective's status over the entire selected time range.
Under the charts, the Component Impact graph shows components that have burned the composite's error budget within the composite's time window. The impact of each component is represented by the width of its row in the graph.
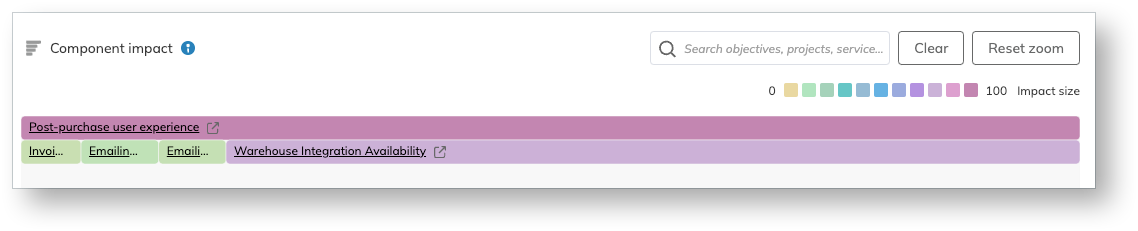
The Component Impact graph shows all components that contributed to the composite error budget burn during the composite's time window. A component remains visible as long as its "bad" event remains within the composite's time window—even if the component is currently healthy and the event has rolled out of the time range you're currently viewing.
If no components have errors within the composite's time window, the graph appears empty.
You can search, filter, and zoom in on the graph to focus on specific components. To zoom in, click a component's row; to zoom out, click Reset zoom.
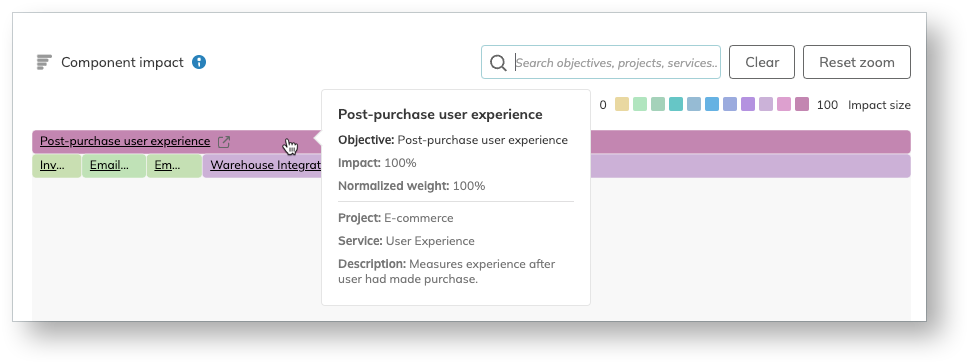
Hover over a component's row to view its metadata, including:
- Component name
- Component objective name
- Component impact (in percent)
- Component normalized weight (in percent)
- The enclosing project and service name
To open a component's details page, click the ![]() icon next to its name.
icon next to its name.
Structure
The Structure tab displays the complete hierarchy of your composite SLO, including all its components and any nested levels. By default, components are sorted in descending order of their impact on the composite.
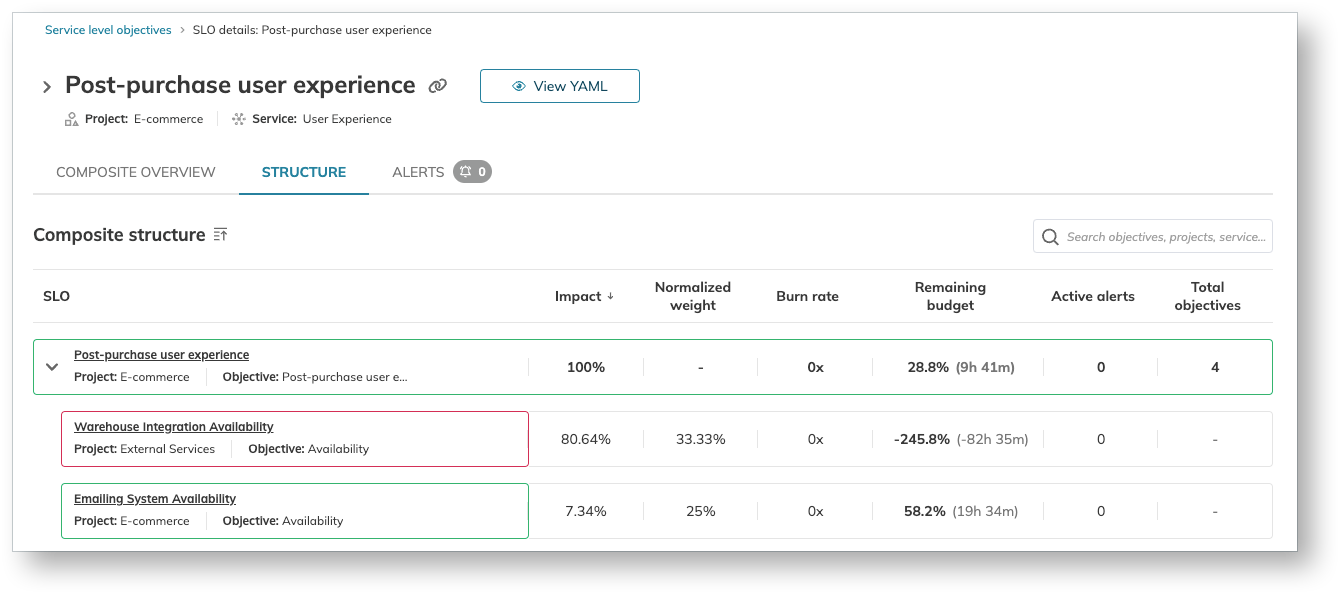
In the Composite structure block, you can sort the components by any of the following columns:
- Impact
- Normalized weight1
- Burn rate
- Remaining error budget
- Active alerts
- Total objectives
The total weight of all components in a composite is normalized to sum up to 1 (or 100%). While you can assign any numerical value for a component's weight, it will be converted to a percentage representing its proportion relative to the other components.
Click on any component to open its details page.

