Reliability Roll-up report
The Reliability Roll-up report provides an aggregated view of performance across multiple SLOs. It simplifies complex reliability data into a single reliability score, allowing stakeholders to assess the health of their projects or services at a glance without reviewing individual error budgets.
The reliability roll-up reports are designed for trend analysis and executive reporting. It helps you:
- Quantify overall health by converting technical SLO performance into a percentage-based score
- Identify patterns by comparing reliability across different teams, services, or time intervals
- Simplify communication by providing non-technical stakeholders with a high-level summary of system stability over a specific period
How it works
Reliability Roll-up aggregates SLO reliabilities into a single, easy-to-understand metric—the reliability score, which serves as an overall reliability assessment of the system's structure you've built. The overall reliability score is the percentage of included SLOs' aggregated reliabilities, calculated from SLO performance against their objective targets over the time windows set for each SLO. Reliability scores are calculated for each report layer and consolidated into the overall reliability score for the entire report.
Example: If an SLO has a 99.9% target and remains above that target for the entire report period, its reliability score is 100%. If it falls below the target for 10% of the reporting interval, its reliability score is 90%.
You can build the report using the auto-generated or custom structure:
- Auto-generated structure applies the Nobl9 default hierarchy to projects, services, and SLOs from the report scope filters. You can select specific resources or include all current and future projects, then use labels to narrow the scope. The all-project scope requires organization-wide project view access.
- Custom structure provides the options to arrange selected Nobl9 projects, services, and SLOs in the hierarchy levels flexibly.
Creating a reliability roll-up report
To create a reliability roll-up report, do the following:
-
Go to the Reports section. Click + Create report.
-
Select the Reliability Roll-up tile and enter the name for your report.
-
Create reliability score layers.
Choose the structure type:- Auto-generated: Automatically arranges resources according to the Nobl9 hierarchy (project > service > SLO). This results in a three-layer report with SLOs at the deepest layers. Select specific resources or use All current and future projects to include projects added later. This option requires organization-wide project view access. Use labels to narrow down the report scope.
- Custom: Manually nest resources (up to eight layers deep) to suit your needs using folders as the structural components.
- Add folders, projects, services, and SLOs:
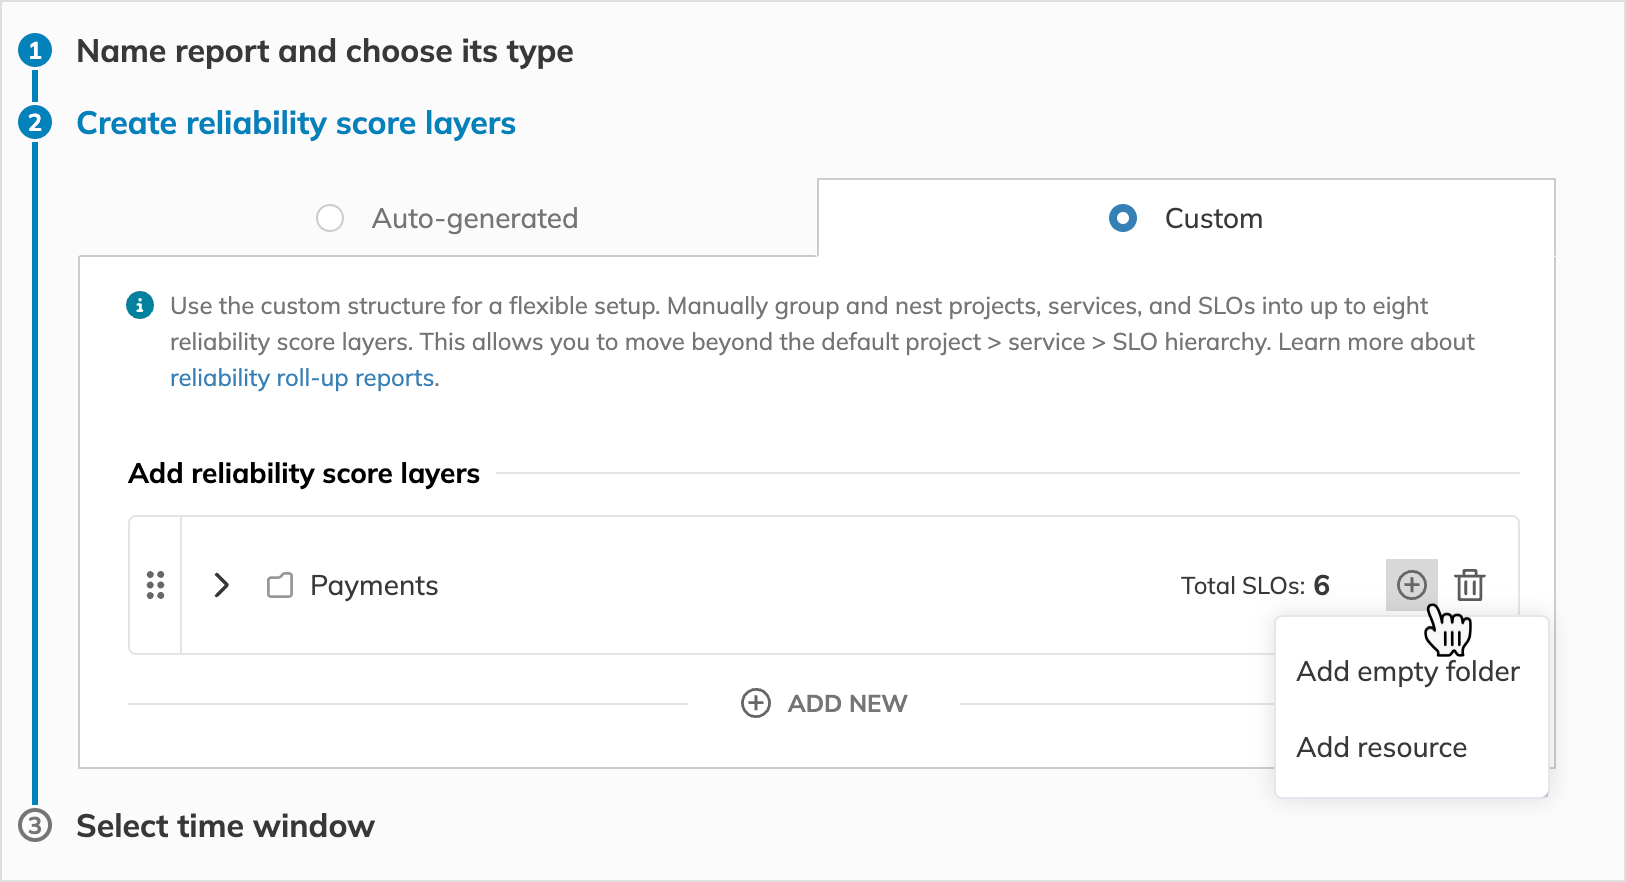
Adding a folder or a resource - Use folders to organize reliability score layers. Move the folders up and down within the same layer:
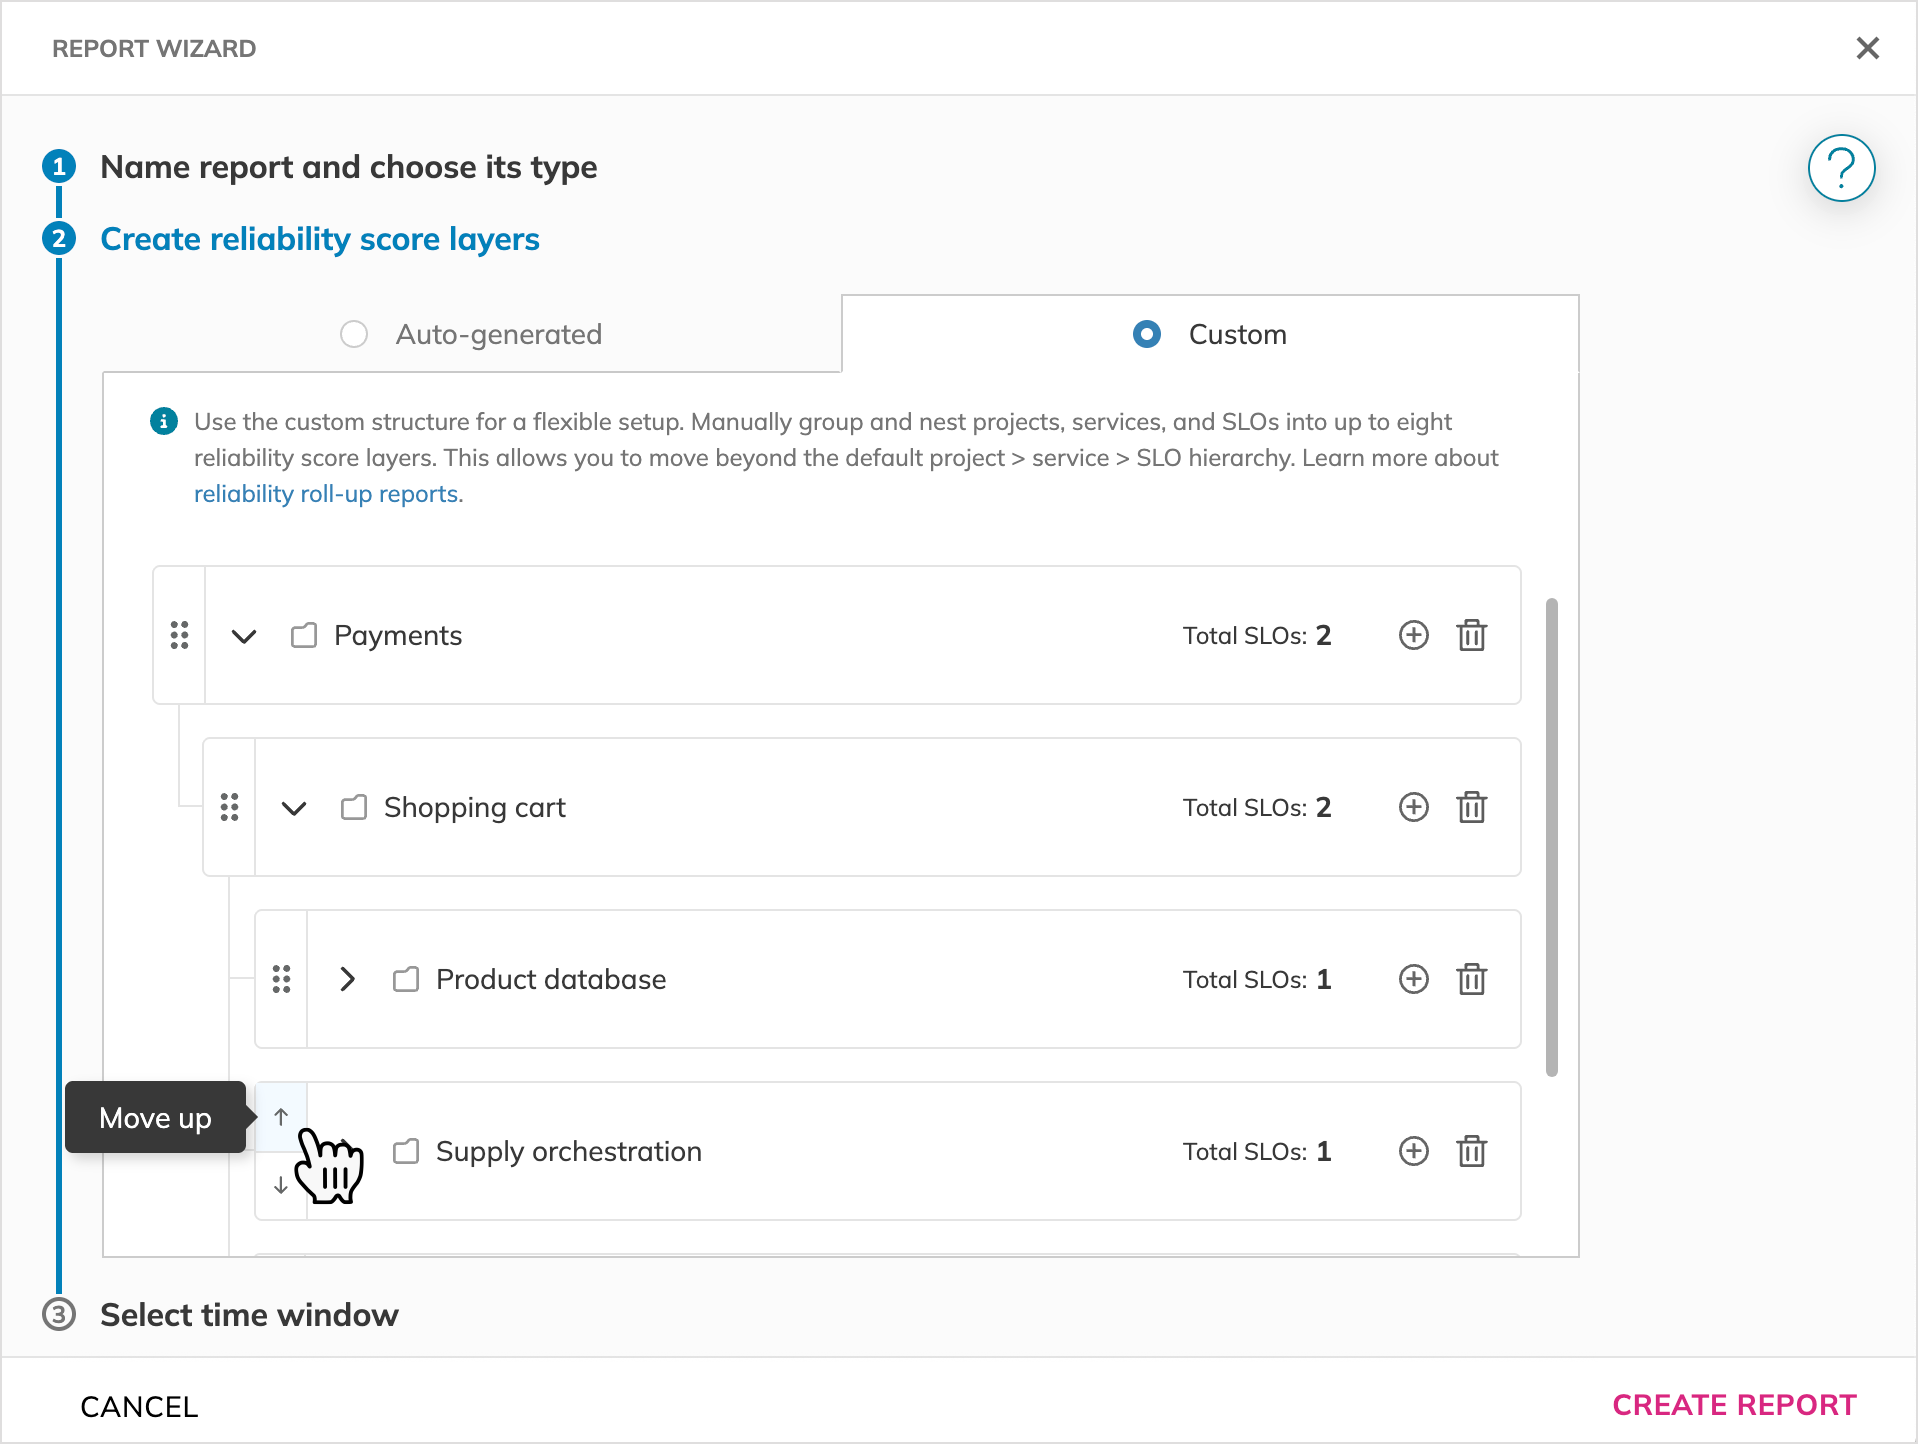
Moving a report folder - To specify a folder or resource name, click it and enter the required name (up to 63 characters):
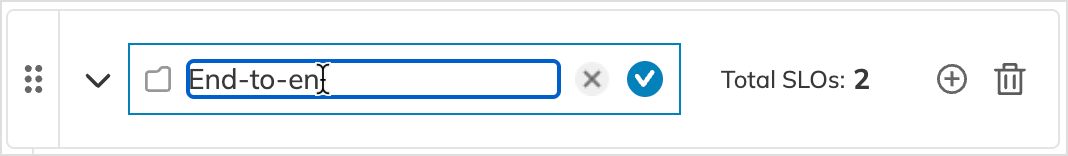
Renaming a folder
Project scopeAll current and future projects is available for the auto-generated structure only. Custom structures use the folders and resources you add manually.
Reports using this scope require organization-wide project view access to open the report or see it in the report list.
Switching between auto-generated and custom structuresYou can switch between auto-generated and custom structures at any time. However, choosing a new structure will override your current configuration after you save your report.
This action cannot be undone. -
Set the reporting time range.
Specify the duration of data you want to include in your report, from 1 week to 1 year.- Time window—choose how the time range is calculated.
- Rolling: Shows a moving window of data from a selected point in the past up to the current moment.
- Calendar-aligned: Aligns the data to fixed calendar boundaries (e.g., daily, weekly, or monthly).
- If no time range is selected, the report defaults to the last month.
- Time zone: All report data is displayed in UTC.
- Time window—choose how the time range is calculated.
-
Click Create report once done.
Report overview
The report calculates reliability scores for each folder. A layer's reliability score is the aggregated reliability score of all its folders and SLOs. The report calculates the all-layer reliability score moving up the hierarchy from the deepest to the topmost layers.
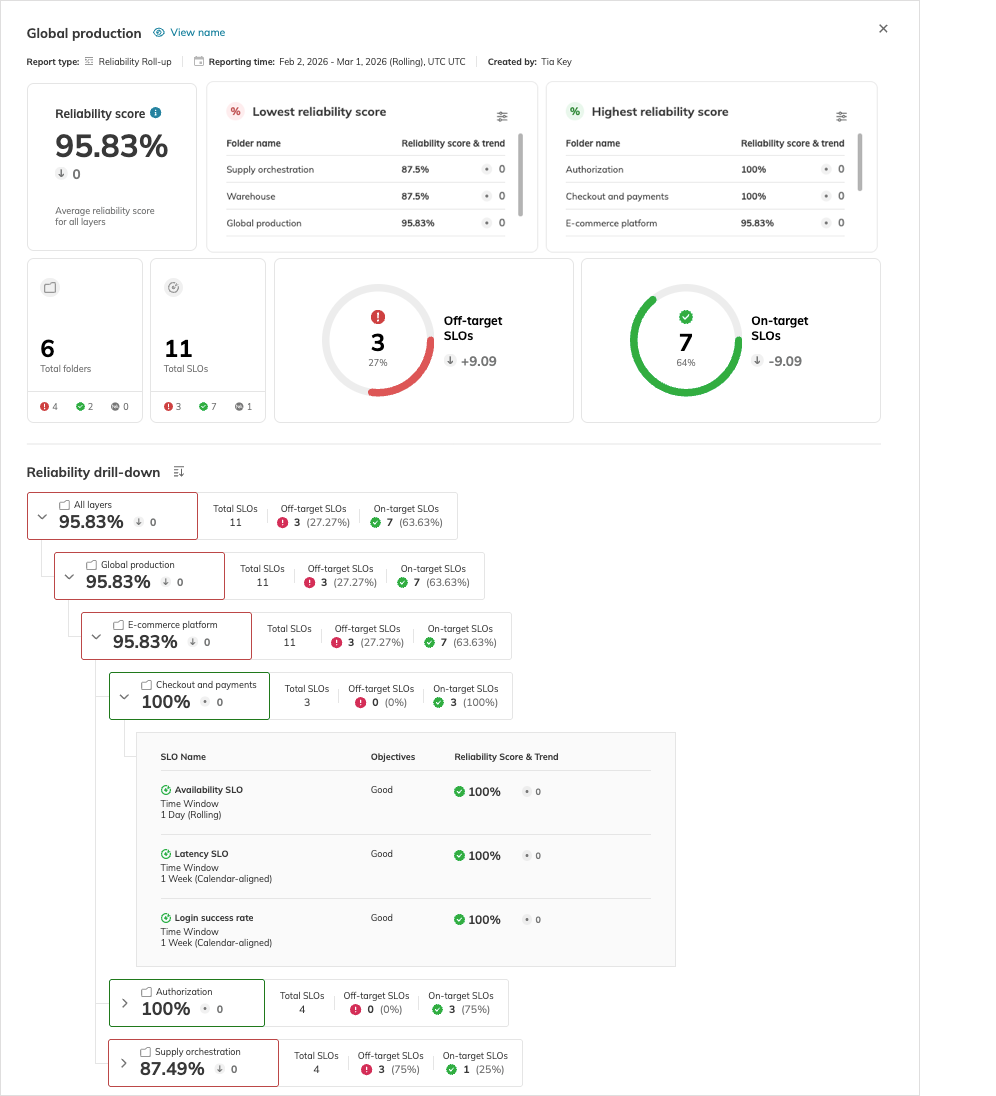
The report layout is split into the statistics block and the reliability drill-down tree.
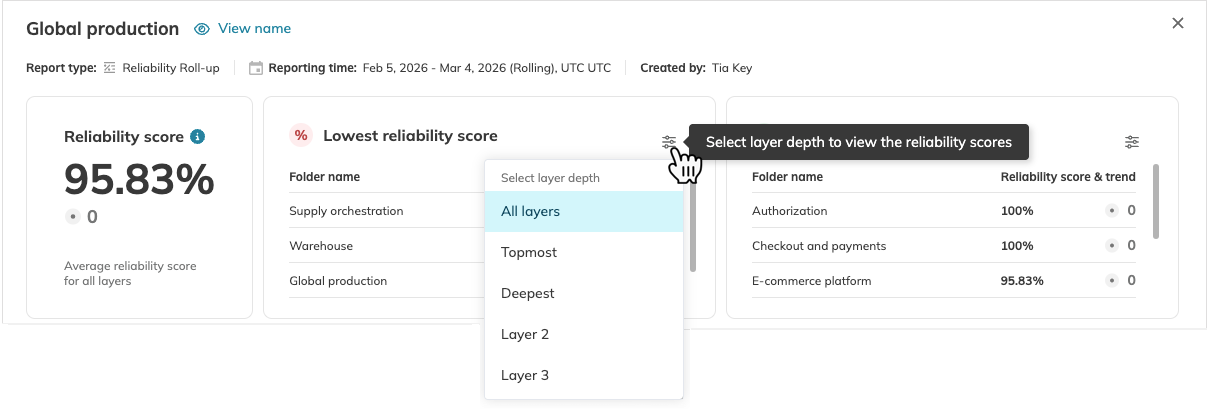
Statistics
Statistics include the reliability score for all layers, drilling down layer by layer up to the deepest ones (SLOs). Along with the score, the report provides its trend if data for the current and previous report ranges are available.
Next to the all-layer reliability score, the Lowest reliability score and Highest reliability score tables display the folders in bottom-10 (low-to-high) and top-10 (high-to-low) rankings, accordingly.
To view a specific layer in these ranking tables, click ![]() on the required table and select the layer you need:
on the required table and select the layer you need:
| Category | Description |
|---|---|
| Total folders | Total number of folders (projects and services for the auto-generated structure) in the report |
| Total SLOs | Total number of SLOs per layer |
| On-target SLOs | Number of SLOs that have maintained stable target adherence during the entire reporting interval |
| Off-target SLOs | Number of SLOs that have had any dips below the target during the reporting interval |
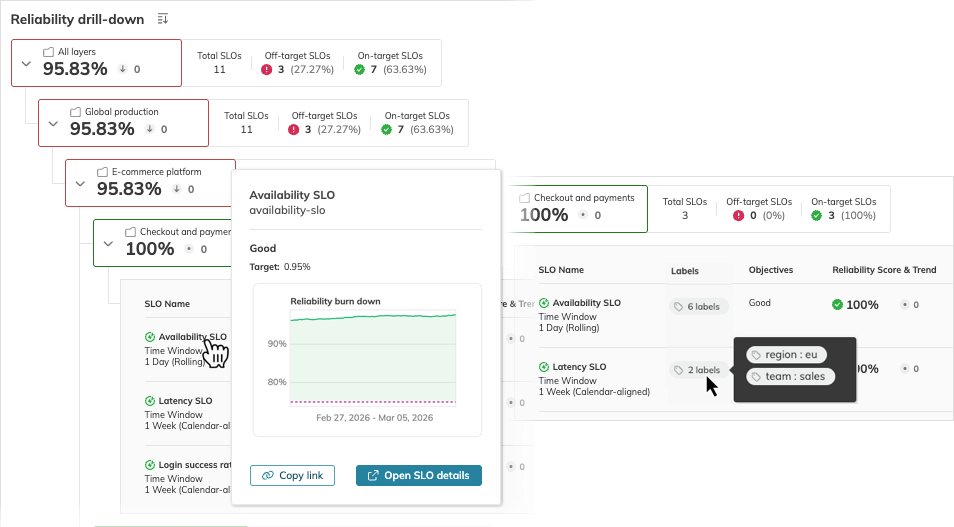
Reliability drill-down
The reliability drill-down is a collapsible tree that granularly displays the reliability score of each layer, folder, and SLO. Expand a folder to view the resources it contains.
You can preview an SLO’s Error Budget Remaining chart, copy the link to this SLO, open this SLO details page, and view the labels attached to it. To do this, hover over the required area in the SLO row:
Reliability score
The reliability score reflects the health of a service, project, or folder based on how often the SLOs it includes meet their targets. The reliability score measures the percentage of a period during which your SLOs successfully hit their targets—a score 100% means an SLO meets its target without burning the error budget to zero. If, for example, the SLO is below the target for 10% of the measured period, the score decreases by 10% and becomes 90%.
The method for calculating the reliability score varies based on the SLO's time window.
- For SLOs with rolling time windows, where data points are consistently added and dropped as the window moves forward, the reliability score calculations account for each data point's adherence to the SLO target and provide a daily target-adherence percentage.
- For SLOs with calendar-aligned time windows, the primary focus is on whether the SLO meets its target at the end of its calendar-aligned window, with the score calculated based on the final measurements.
Rolling SLOs
With rolling time windows, the reliability score is calculated as the ratio of in-budget data points to the total data points (in-budget + out-of-budget). It uses the error budget remaining state and works as follows:
- Define the error budget state.
Every data point is marked as in-budget (error budget remaining >= 0) or out-of-budget (error budget remaining < 0) - Calculate a daily ratio.
For each day, the ratio of in-budget points to total points is calculated. - Compute the final score.
The score for the entire reporting window is the average of these daily ratios.
Reliability score = (in-budget / (in-budget + out-of-budget))
Calendar-aligned SLOs
With calendar-aligned time windows, the reliability score is calculated at the end of each day and at the completion of the reporting interval. The calculations are based on whether the reliability burn down values—the good-to-total ratio of the data points received—meet the target at the end of these periods.
- The value >= target: the reliability score is 100%
- The value < target: is the ratio of the burn-down value to the target
The reliability score for a reporting interval is calculated using the two anchor scores:
- The time window anchor is the reliability score at the end of the SLO's time window
- The daily anchor is the reliability score at the end of the finished day
These anchor values are averaged according to the following formula:
Reliability score = (time window anchor + daily anchor)/2
For example, if the anchor reliability scores are 94% (SLO's time window) and 100% (daily), the averaged reliability score is 97%.
Reliability score layering
The calculation order follows a recursive, bottom-up logic, starting with individual SLO objectives and aggregating them up through the organizational hierarchy.
The table lists the order of layering calculations.
| Order | Hierarchy level | Calculation logic |
|---|---|---|
| 1 | Objective | Evaluates objective's target adherence: • 100% if the target is met steadily over the reporting interval • < 100% if the objective falls below the target anytime during the reporting interval |
| 2 | SLO | The average of all reliability scores from the objectives of that SLO. |
| 3 | Folder | The average of all reliability scores from the SLOs contained within that folder. |
| 4 | Layer | The average of all reliability scores from the folders belonging to that layer. |
| 5 | Higher layers | A recursive average from all underlying children. |
| 6 | Total report | The final all-layer reliability score, representing the average of all underlying layers. |
For example, in the following hierarchy:
Producers
└── Data intake (RC 95.5%)
└── Data processor (RC 90%)
The reliability score of the Producers folder is 92.75%. It's the average of the reliability scores of its children:
Reliability score = (95.5 + 90)/2
Navigation and filtering
Reports can scale to include dozens of folders across up to eight layers. To refine your view without changing the report’s underlying scope, use the interactive search, filtering, and sorting tools. These view settings are persisted in the URL, allowing you to return to your filtered results or share specific perspectives with others in your organization.
| Feature | Method | Details and options |
|---|---|---|
| Search | Find in report field | • Min. 3 characters; case-insensitive. • Highlights search matches within resource names and expands the first matching folder. • Jump between results hitting Enter or with arrows (^ / ⌄) in the search field. |
| Filter by text | Show filters > Text | • Min. 3 characters; case-insensitive • Displays only matching resources. |
| Filter by label | Show filters > Labels | • Display resources with the selected labels. • Filter options include labels assigned to resources within the report. |
| Filter by SLO adherence | Show filters > SLO adherence | • Off-target SLOs: < 100% reliability score • On-target SLOs: 100% reliability score • N/A: No reliability data available for the reporting interval. |
The filtered report displays matching resources with all their parent folders and updates the Statistics block to reflect their specific scores.
The table lists the filtering logic applied when you select several filters.
| Filter combination | Displayed resources | Scope impact |
|---|---|---|
| Different filters | Match all | Narrow |
| Labels with different keys | Have all | Narrow |
| Labels with the same key and different values | Have any | Broaden |
You can also sort the reliability drill-down tree in ascending or descending order by Name or Reliability score. Sorting applies recursively across the entire report, from the topmost to the deepest layers.
Additionally, for Custom reports, the Original order sorting is available. It resets any sorting to the order configured during report creation.
Default sorting behavior:
- Custom reports follow your user-defined structure.
- Auto-generated reports are sorted alphabetically in ascending order.
- N/A reports are displayed at the bottom of the sorted tree.
Sorting in reliability roll-up reports is based on the resource name identifier, which may differ from the display name shown in the UI.
Key takeaways
- Structure components—folders, projects, and services—are treated as report folders distributed across report layers.
- Using a custom structure, you can adapt your reliability roll-up report to your requirements, creating custom layers with the required granularity. While the auto-generated structure arranges projects at the topmost layer, services at the second, and SLOs at the third (and the deepest) layer, the custom structure features only two limits:
- Maximum eight layers
- SLOs are always the deepest layer—you cannot nest anything under them
- Report layers aggregate the reliability scores of the resources they contain.
- Layers without SLOs don’t affect the reliability score calculations. In this case, N/A is displayed instead of the reliability score for that layer.
- Access permissions in reliability roll-up reports are defined by resources in the scope. Reports using All current and future projects require organization-wide project view access to open the report or see it in the report list.
- Reliability roll-up reports display time in UTC.
- Composite SLOs aren’t added as separate objectives in reliability roll-up reports.
- Any operations with SLOs and objectives—replaying, adjusting budgets, editing, or moving—result in the reliability score being recalculated at all layers if those SLOs are included in the report.
| Feature | Auto-generated | Custom |
|---|---|---|
| Maximum depth | Three layers | Eight layers |
| Hierarchy logic | Fixed: project > service > SLO | User-defined: can be mapped to business logic |
| Structure pattern | Parallel: every branch has the same fixed depth. Projects (always topmost) > services (2nd layer) > SLOs (deepest) | Asymmetric: branches can vary in depth. Projects and SLOs can coexist on the same level |
Useful links

 Reports overviewReportsSharing reportsReportsReliability and error budget calculationsSLO guidesCalendar-aligned SLOsSLO guidesRolling SLOsSLO guidesService level objectivesSLOsSLO managementSLOsComposite SLOsSLOsReplayNobl9 featuresBudget adjustmentsNobl9 featuresProject-level rolesRBAC