AMS Prometheus
Amazon Managed Service for Prometheus (or AMS Prometheus) is a monitoring and alerting service that ensures easy-to-use monitoring of containerized applications and infrastructure. It's scalable, and you don't have to worry about hosting it yourself.
Amazon Prometheus parameters and supported features in Nobl9
- General support:
- Release channel: Stable,
Beta
- Connection method: Agent
- Replay and SLI Analyzer: Historical data limit 30 days
- Event logs: Not supported
- Query checker: Not supported
- Query parameters retrieval: Supported
- Timestamp cache persistence: Supported
- Connection method: Agent
- Query parameters:
- Query interval: 1 min
- Query delay: 0 sec
- Jitter: 15 sec
- Timeout: 30 sec
- Query delay: 0 sec
- Agent details and minimum required versions for supported features:
- Plugin name: n9prometheus
- Query delay environment variable: PROM_QUERY_DELAY
- Replay and SLI Analyzer: 0.65.0
- Query parameters retrieval: 0.73.2
- Timestamp cache persistence: 0.65.0
- Custom HTTP headers: 0.88.0 / 0.83.0-beta
- Query delay environment variable: PROM_QUERY_DELAY
- Additional notes:
- Support for Prometheus metrics
- No support for IAM roles for bare EC2 instances
- Learn more

- No support for IAM roles for bare EC2 instances
Authentication
For more details, refer to Authentication for AMS Prometheus.
To set up the connection, AMS Prometheus requires users to enter the URL. To get the URL:
-
Sign in to your AWS account.
-
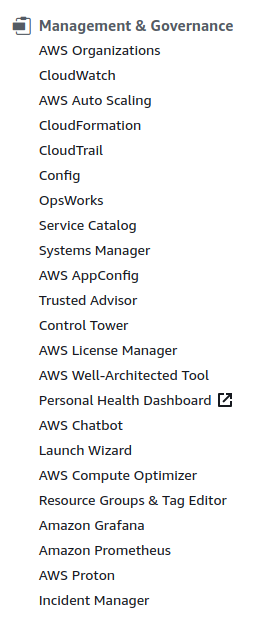
Click the AMS Prometheus in the Management & Governance panel:

Image 1: Configuring authentication for AMS Prometheus (1) -
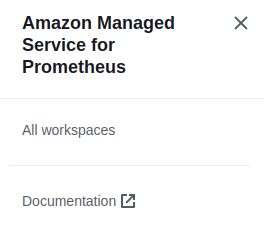
Click All workspaces.

Image 2: Configuring authentication for AMS Prometheus (2) -
Choose a relevant workspace:

Image 3: Configuring authentication for AMS Prometheus (3) -
In the Summary screen, copy the
Endpoint - query URL
Image 4: Configuring authentication for AMS Prometheus (4)
The url that you need is the Endpoint - query URL without the /api/v1/query string at the end of the URL.
Adding Amazon Managed Service for Prometheus as a data source
To ensure data transmission between Nobl9 and Amazon Prometheus, it may be necessary to list Nobl9 IP addresses as trusted.
IP addresses to include in your allowlist for secure access
- 18.159.114.21
- 18.158.132.186
- 3.64.154.26
- 34.121.54.120
- 34.123.193.191
- 34.134.71.10
- 35.192.105.150
- 35.225.248.37
- 35.226.78.175
- 104.198.44.161
You can add the AMS Prometheus data source using the agent connection method.
Nobl9 Web
Follow the instructions below to create your AMS Prometheus agent connection:
- Navigate to Integrations > Sources.
- Click
.
- Click your required Source tile.
- Choose Agent.
-
Select one of the following Release Channels:
- The
stablechannel is fully tested by the Nobl9 team. It represents the final product; however, this channel does not contain all the new features of abetarelease. Use it to avoid crashes and other limitations. - The
betachannel is under active development. Here, you can check out new features and improvements without the risk of affecting any viable SLOs. Remember that features in this channel can change.
- The
-
Add the URL to connect to your data source (mandatory).
Refer to Authentication for AMS Prometheus for detailed instructions on how to get the URL. -
Enter a Region (mandatory).
The list of supported Regions for AMS Prometheus is here. -
Set Step to define the metric resolution (mandatory, default:
60seconds).
The Step value must be a positive integer. It controls how many data points Nobl9 retrieves in a single query.- For optimal operation, consider the following recommendations for its value:
- Aim for 15 seconds or more
- Keep it less than or equal to your AMS Prometheus query interval
Minimum agent version requirementThe Step parameter is supported starting from Nobl9 agent versions0.105.0-betaor0.105.0and later.
- Select a Project (mandatory).
Projects provide the structure for organizing Nobl9 resources and managing access permissions.
If a project is not specified, Nobl9 assigns the default project value automatically. - Enter a Display Name (optional).
Spaces are allowed. - Enter a Name (mandatory).
The name is mandatory and can only contain lowercase, alphanumeric characters, and dashes (for example,my-project-1). Nobl9 duplicates the display name here, transforming it into the supported format, but you can edit the result. - Enter a Description (optional).
Provide extra details, such as the purpose and responsible personnel.
Up to 1050 characters. - Specify the Query delay to set a customized delay for queries when pulling the data from the data source.
- The default value in AMS Prometheus integration for Query delay is
0 seconds.
Changing the query delayChanging the query delay can affect your SLI data.
Learn more about query delay and its impact. - The default value in AMS Prometheus integration for Query delay is
- Configure how Nobl9 uses your data source’s historical data for Replay and SLI Analyzer.
These features allow you to backfill SLOs or analyze SLIs for assisted SLO creation. - Maximum period for historical data retrieval (optional).
- Defines the furthest point in the past from which data can be retrieved.
- To activate Replay and SLI Analyzer for your data source, set this value to a positive whole number.
- The maximum period is capped by your data source's specific limitations. Find the maximum value for your data source.
- Default period for historical data retrieval (optional).
- Sets the automatic backfill window for new SLOs using this data source.
- Enter 0 or a positive whole number (default: 0). You can change this value for individual SLOs during creation.
- Setting a non-zero value results in automatic replay of newly created SLOs based on this data source, so they report past performance upon creation, rather than waiting for new data to accumulate.
- Click Add Data Source
- Deploy your agent in a Kubernetes cluster or Docker container.
To configure custom HTTP headers for your Nobl9 agent, include them in your agent deployment.
YAML
- Create a YAML definition to set up an agent connection with AMS Prometheus. For this, refer to the following example:
apiVersion: n9/v1alpha
kind: Agent
metadata:
  name: amazon-prometheus
  displayName: Amazon Prometheus Agent
  project: default
  annotations:
    area: latency
    env: prod
    region: us
    team: sales
spec:
  description: Example Amazon Prometheus Agent
  releaseChannel: stable
  amazonPrometheus:
    url: https://aps-workspaces.us-east-1.amazonaws.com/workspaces/ws-f49ecf99-6dfa-4b00-9f94-a50b10a3010b
    region: us-east-1
    step: 60
  historicalDataRetrieval:
    maxDuration:
      value: 30
      unit: Day
    defaultDuration:
      value: 15
      unit: Day
  queryDelay:
    value: 1
    unit: Second
| Field | Type | Description |
|---|---|---|
queryDelay.unitMandatory | enum | Specifies the unit for the query delay. Possible values: Second | Minute. • Check query delay documentation for default unit of query delay for each source. |
queryDelay.value Mandatory | numeric | Specifies the value for the query delay. • Must be a number less than 1440 minutes (24 hours). • Check query delay documentation for default unit of query delay for each source. |
releaseChannelMandatory | enum | Specifies the release channel. Accepted values: beta | stable. |
| Source-specific fields | ||
amazonPrometheus.urlMandatory | string | is the `Endpoint - query URL` in AMS Prometheus. Check Authentication for AMS Prometheus for detailed instructions on how to get it |
amazonPrometheus.regionMandatory | string | Check the list of supported regions for AMS Prometheus. |
amazonPrometheus.stepMandatory | integer | Defines metrics resolution in seconds. Must be a positive integer, 60 seconds by default. Recommendations: Use a value of at least 15 seconds and less than or equal to your AMS Prometheus query interval. |
| Replay-related fields | ||
historicalDataRetrievalOptional | n/a | Optional structure related to configuration related to Replay. ❗ Use only with supported sources. • If omitted, Nobl9 uses the default values of value: 0 and unit: Day for maxDuration and defaultDuration. |
maxDuration.valueOptional | numeric | Specifies the maximum duration for historical data retrieval. Must be integer ≥ 0. See Replay documentation for values of max duration per data source. |
maxDuration.unitOptional | enum | Specifies the unit for the maximum duration of historical data retrieval. Accepted values: Minute | Hour | Day. |
defaultDuration.valueOptional | numeric | Specifies the default duration for historical data retrieval. Must be integer ≥ 0 and ≤ maxDuration. |
defaultDuration.unitOptional | enum | Specifies the unit for the default duration of historical data retrieval. Accepted values: Minute | Hour | Day. |
To configure custom HTTP headers for your Nobl9 agent, include them in your agent deployment.

