SLO oversight dashboard Enterprise
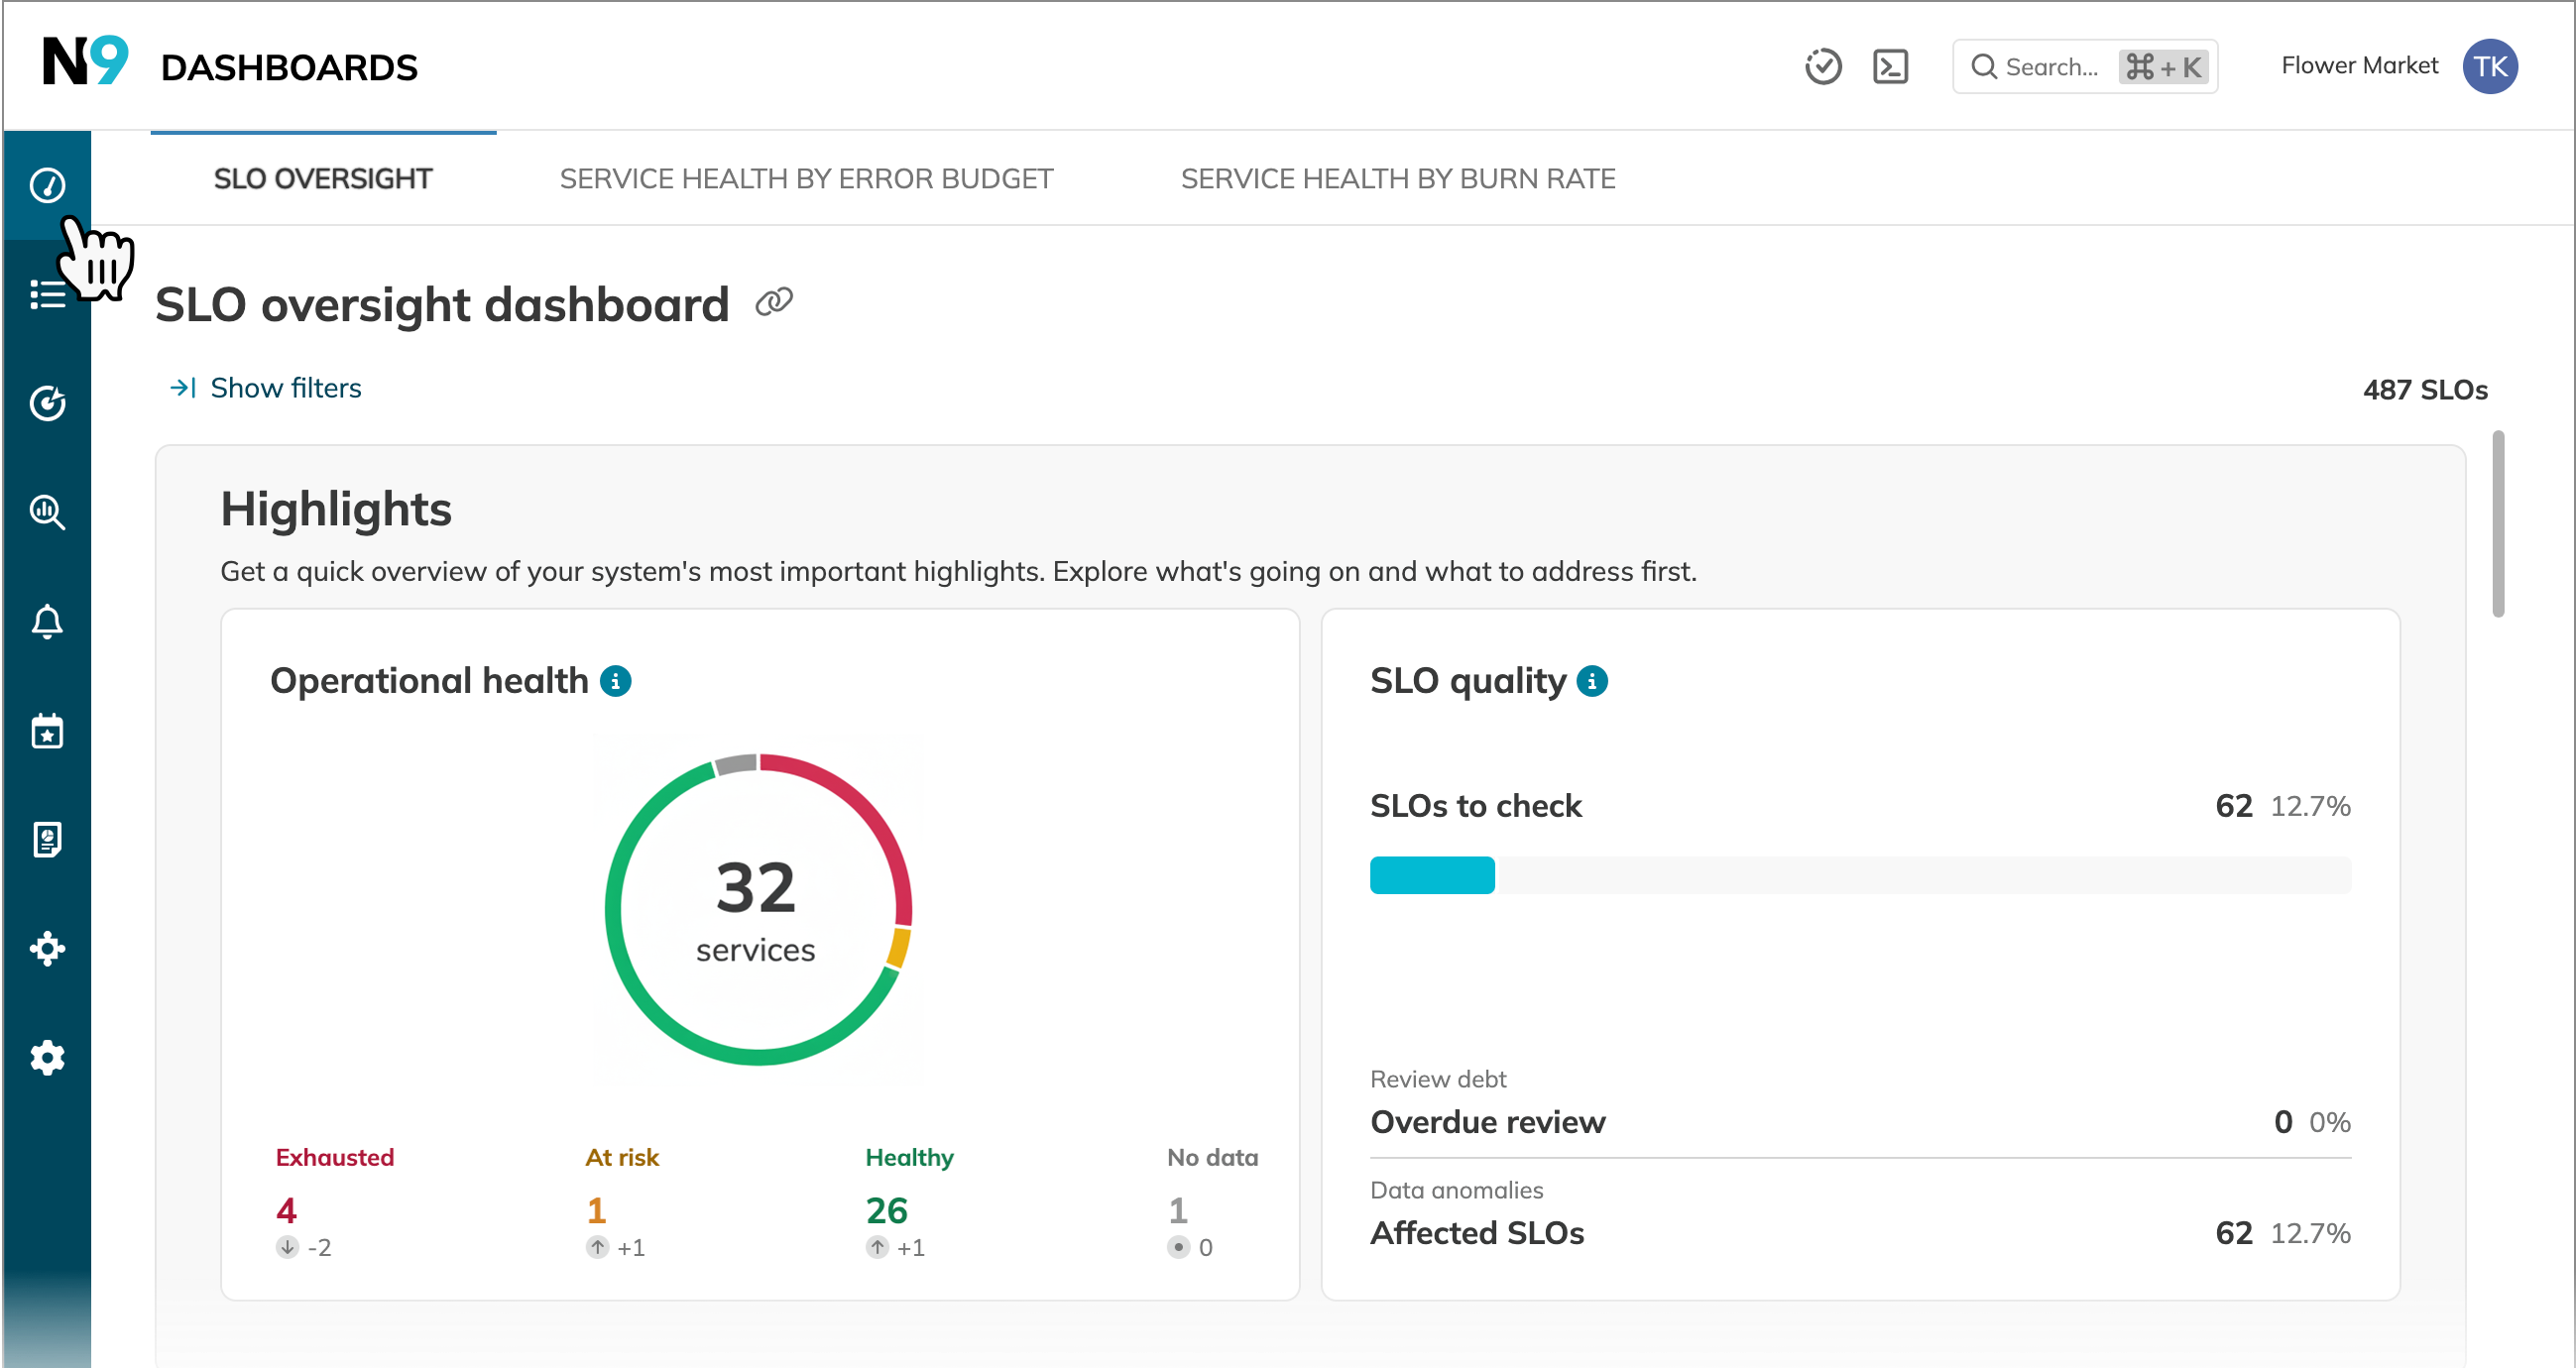
The SLO oversight dashboard provides a high-level overview of the current state of your SLOs. It brings together critical metrics for monitoring service health, detecting anomalies, and tracking overdue reviews. With its interactive widgets, the dashboard enables you to stay on top of your organization's reliability goals.
It is made up of the following widgets:
- Highlights with key statistics about your service health, SLO review debt, and data integrity
- Operational health displays the details on the current health of your services and SLOs based on the remaining error budget, segregating them into Healthy, At risk, Exhausted, and No data categories
- SLO quality focuses on SLO review debt and data integrity
To access the SLO oversight dashboard, go to the Dashboards page and open the SLO oversight tab.
- The Organization admin can configure which resources are displayed on the dashboard
- You can access resources from the projects you have permission to view
- Users can filter the dashboard by project, service, or label
- Filters applied are only visible to you and will not affect other users’ views
- You can share the dashboard along with your applied filters by sharing its link
The Highlights widget summarizes key statistics from the Health and SLO quality widgets. It helps you quickly identify areas requiring immediate attention.
- Operational health visualizes the current health of your services
- SLO quality shows the number of flagged SLOs—with an overdue review or data anomalies
Operational health widget
The Operational health widget provides detailed insights into the remaining error budget for services and SLOs, grouped under Healthy, At risk, Exhausted, and No data categories. The categories are defined using the thresholds set for the Service health dashboard by error budget.
This widget breaks down the health information by service and SLO. The detailed view includes:
- The Error budget status diagrams visualize health categories with weekly trends
- The Top budget-consuming services or SLOs table links to pre-filtered lists, enabling further analysis
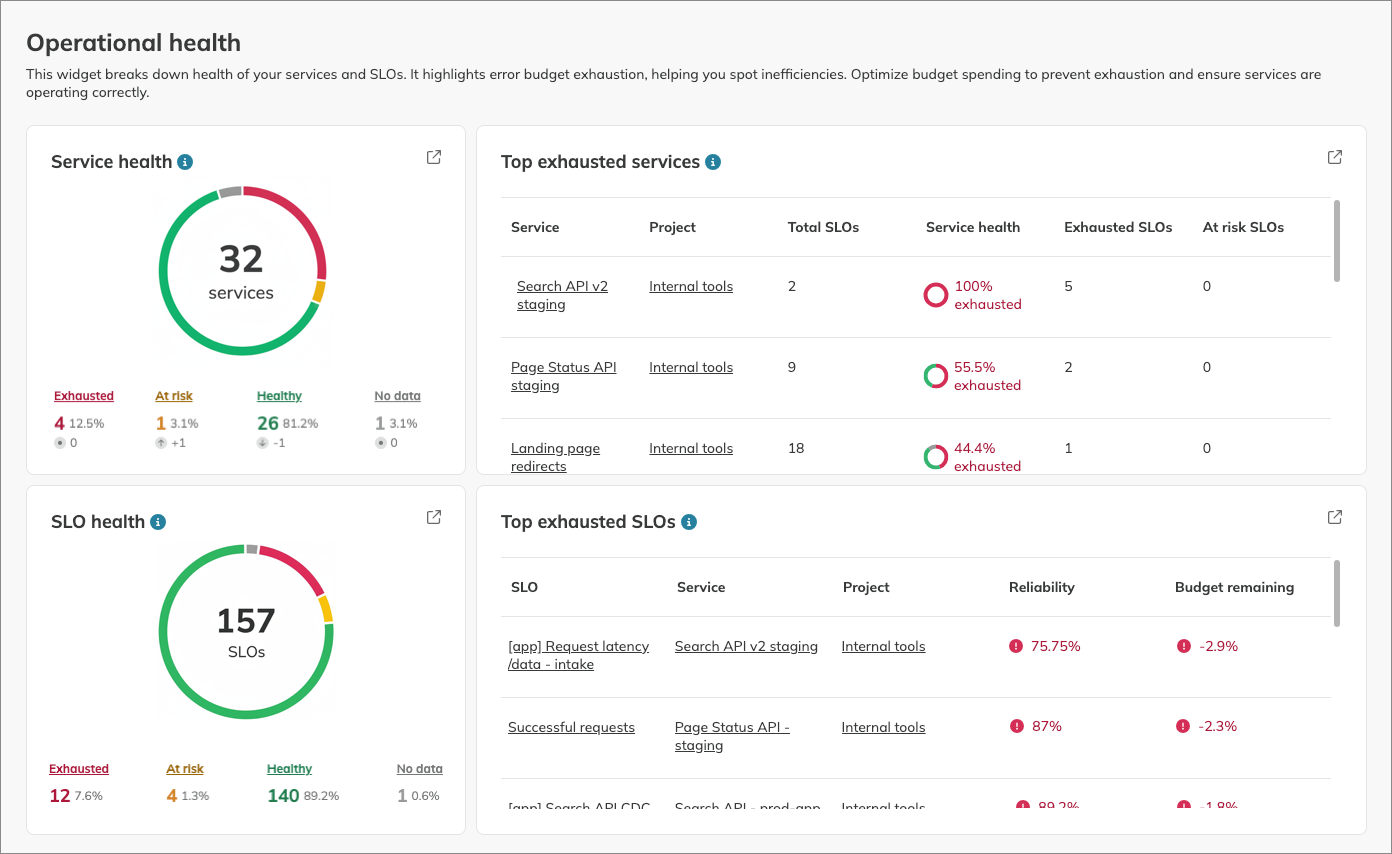
Each section of the widget links to a more detailed view.
To open the required view, click ![]() at the top-right corner of a widget.
at the top-right corner of a widget.
| Click | Opens |
|---|---|
| Service health | Service health dashboard by error budget |
| Exhausted, At risk, Healthy, and No data services | Service health dashboard, pre-filtered by the corresponding error budget state |
| Top exhausted services | Service list, sorted by the highest error budget exhaustion in the descending order |
| SLO health To exhausted SLOs | SLO list, sorted by the remaining error budget in the descending order |
| Exhausted, At risk, Healthy, and No data SLOs | SLO list, pre-filtered by the corresponding error budget state |
SLO quality widget
Regular reviews and no data anomalies in your SLOs indicate a good SLO quality. To help increase the quality of your SLOs, the SLO quality widget flags SLOs with review or data integrity issues.
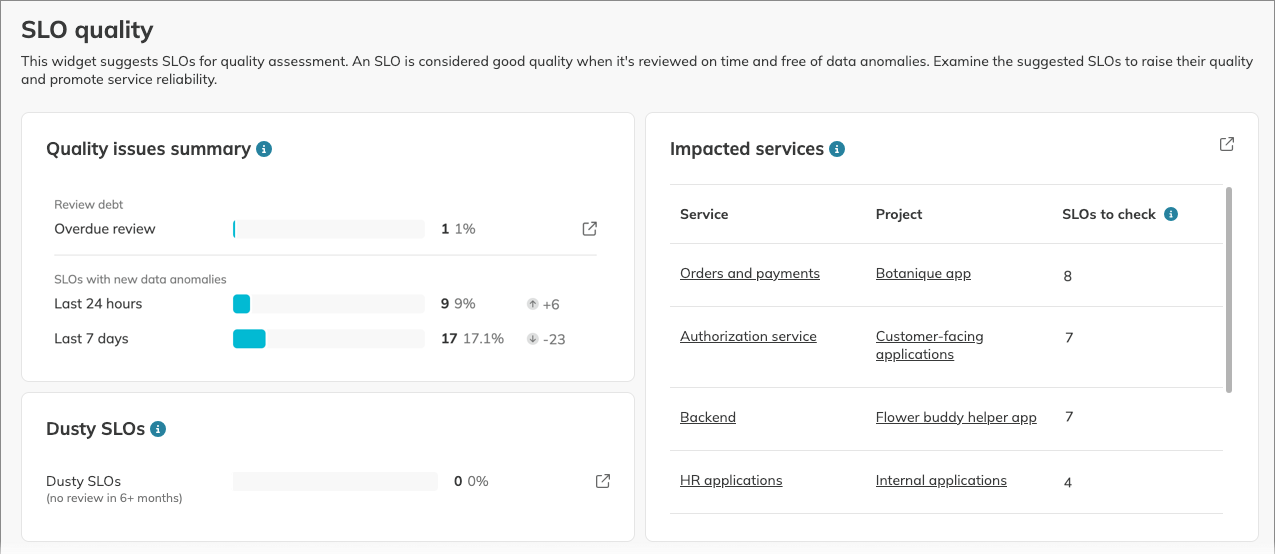
The left block of Quality issues summary presents statistics and trends for the following SLOs:
| SLOs with quality issues | Description |
|---|---|
| Overdue SLOs | SLOs that were not reviewed by their due date. |
| Dusty SLOs | SLOs that have not been reviewed for at least six months. This timeframe is fixed. |
| SLOs with new data anomalies (last 24 hours / 7 days) | SLOs where new data anomalies were detected in the last 24 hours or 7 days. This count focuses only on when the anomaly was detected, not on its resolution status. |
The right side of the widget lists the services that have SLOs with the quality issues shown.
Each quality issue category also has its own dedicated widget for more detailed analysis.
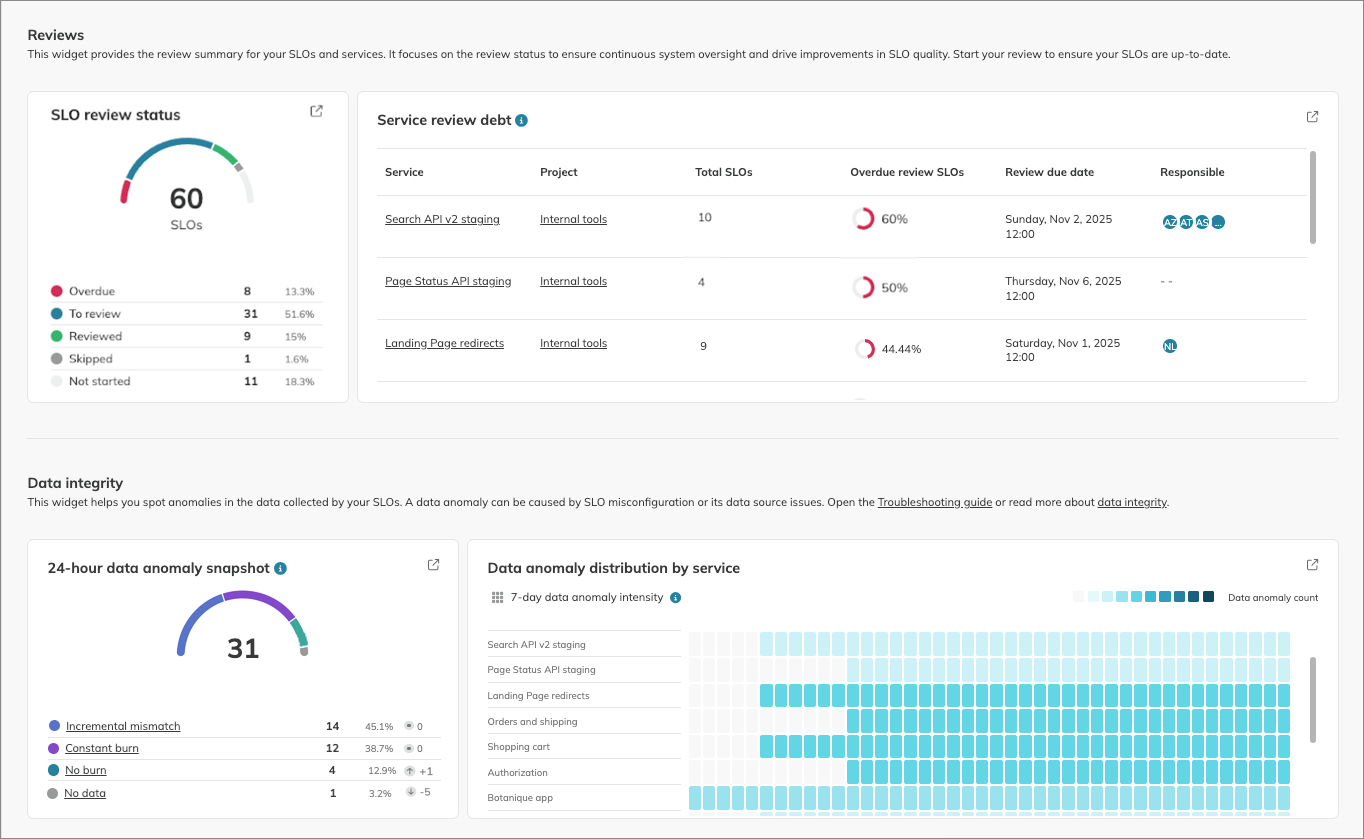
The Reviews widget provides details on review debt and SLO status:
- SLOs by review status
- A list of services with review debt
The Not started status is assigned to SLOs that meet both of the following conditions:
- No review is scheduled for its service.
- The SLO hasn't been individually reviewed.
The Data integrity widget focuses on active data anomalies, regardless of when they were first detected. It includes:
- A diagram of data anomalies that were active (i.e., unresolved or recently resolved) in the last 24 hours.
- A heatmap showing data anomaly intensity by service over the last 7 days. Darker colors indicate higher intensity.
The Data integrity widget counts anomalies based on their resolution status:
- Resolved—anomalies resolved within the last 24 hours (for the diagram) or 7 days (for the heatmap).
- Unresolved—anomalies that are still active.
The Quality issues summary and Data integrity widgets report on data anomalies differently.
- Quality issues focuses on when they were detected
- Data integrity focuses on when they were active
The following table illustrates this difference:
| Scenario | Quality issues summary (detection) | Data integrity (resolution) |
|---|---|---|
| • 3 data anomalies detected 10 days ago • 1 of them was resolved 3 days ago • 2 of them are still unresolved | Last 24 hours: 0 Last 7 days: 0 None of the data anomalies was detected within the last 7 days | Snapshot: 2 Heatmap: 3 2 data anomalies are still active, and 1 was active within the last 7 days |
| • 2 data anomalies detected 3 days ago (resolved instantly) • 1 anomaly detected 3 hours ago (still unresolved) | Last 24 hours: 1 Last 7 days: 3 All three data anomalies were detected within these timeframes | Snapshot: 1 Heatmap: 3 1 data anomaly is active within the 24 hours, and the other 2 data anomalies were active within the week |
Data anomalies can stem from external data source issues or indicate resource misconfiguration in Nobl9. To troubleshoot data source-related problems, refer to the specific data source's troubleshooting guide.
The following table briefly describes data anomaly types, their rules, and potential configuration issues they can indicate:
| Data anomaly type | Description |
|---|---|
| Incremental mismatch | Occurs in ratio SLOs when a non-incremental data point is received by an SLO set to receive incremental data |
| Constant burn | SLO continuously consumes error budget for an unusually extended period |
| No burn | SLO hasn't consumed error budget for an unusually long period |
| No data | SLO reports no data for an unusually extended period |
The widgets follow the usual scheme, including a diagram and a detailed breakdown.
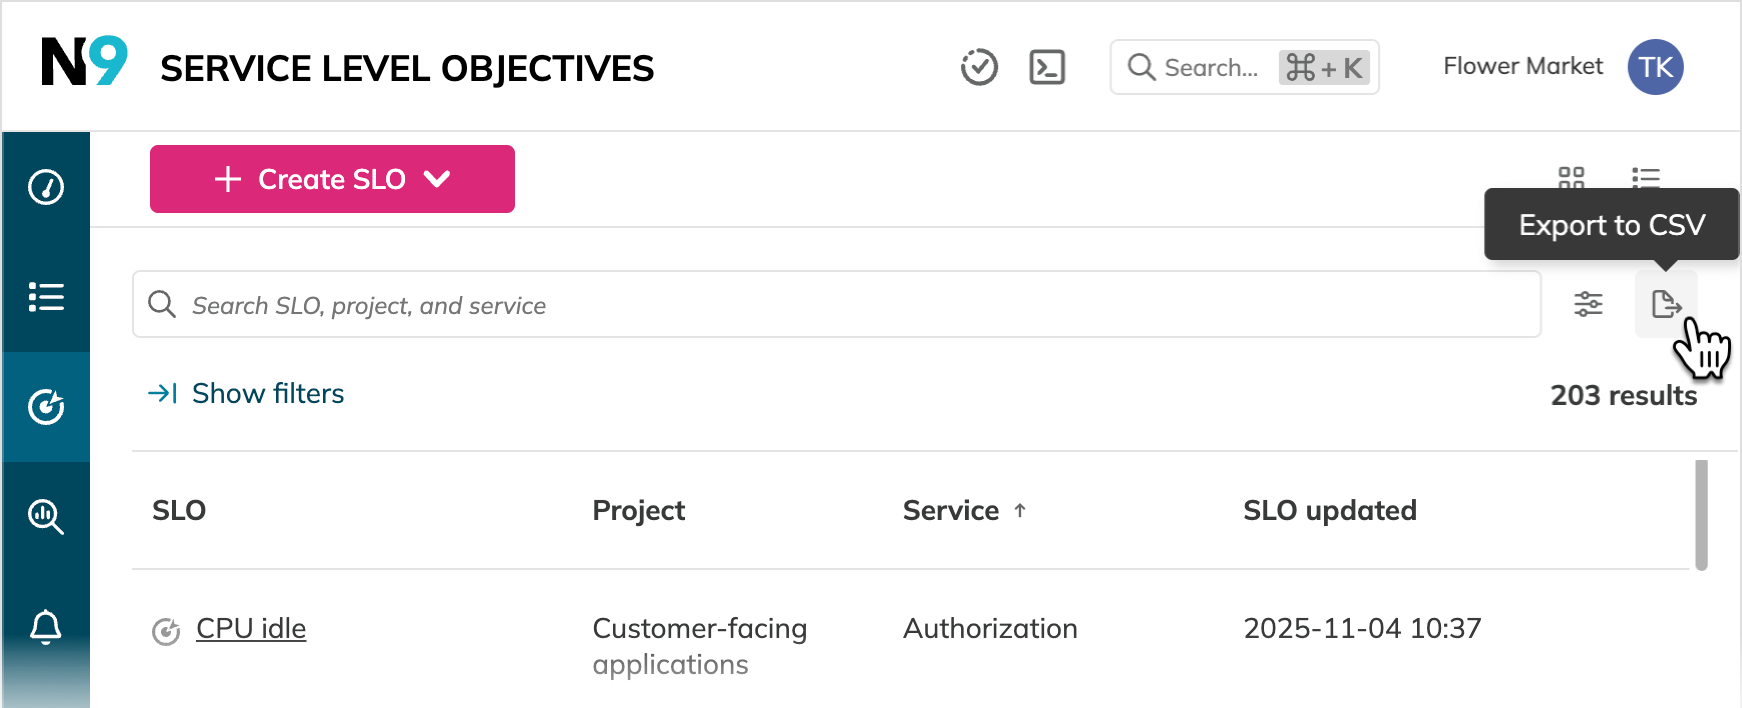
Export SLO list as CSV
When viewing the SLO list opened from the dashboard, you can export the filtered results as a CSV file. To do this, click ![]()
![]() next to the column customization menu.
next to the column customization menu.