SLO annotations
SLO annotations are the notes added to your SLO charts when an outstanding event related to the monitored resource occurs.
You can find SLO annotations on SLO charts, in SLO History reports that include annotated SLOs, and in the Events app section under the Annotations tab.
SLO annotations can be created by users (user annotations) and Nobl9 (system annotations). System annotations relate to alert, budget adjustment, and no data anomaly events.
You can manage SLO annotations
using the Nobl9 Web interface, sloctl,
or Nobl9 API.
System annotations
For each alert, budget adjustment, or no data anomaly event in an SLO, Nobl9 adds an annotation to the affected SLO objective chart.
Such annotation is displayed as a time range with startTime representing the timestamp of the event start
and endTime representing the timestamp of the event resolution or cancel.
System annotations include the following details:
- Time of annotation creation
- Period of event duration
- Project, service, and SLO names
Additional information depends on the event.
Alert:
- Alert policy and condition
- Affected objective name
- Alert ID with the link to the alert details
Budget adjustment event:
- Budget adjustment name
- The name of the objective with budget adjusted
- First budget adjustment start date and duration
- Recurrence rule, if defined
No data anomaly:
- Affected SLO objective name
- Time of the last data point registration in a data source
- Anomaly detection time
This is the time when a Nobl9 query to the data source returned no data, plus the configured wait time for SLO no data anomaly notifications
Key takeaways
-
No data anomaly annotation duration depends on query parameters, like query delay or interval.
For example, if a query delay is applied, Nobl9 queries for data some time after it was initially registered in the data source. The annotated period reflects this: the SLO charts display data point timestamps based on what's logged in the data source, while the annotated period is based on Nobl9's anomaly detection time influenced by the responses from Nobl9 queries.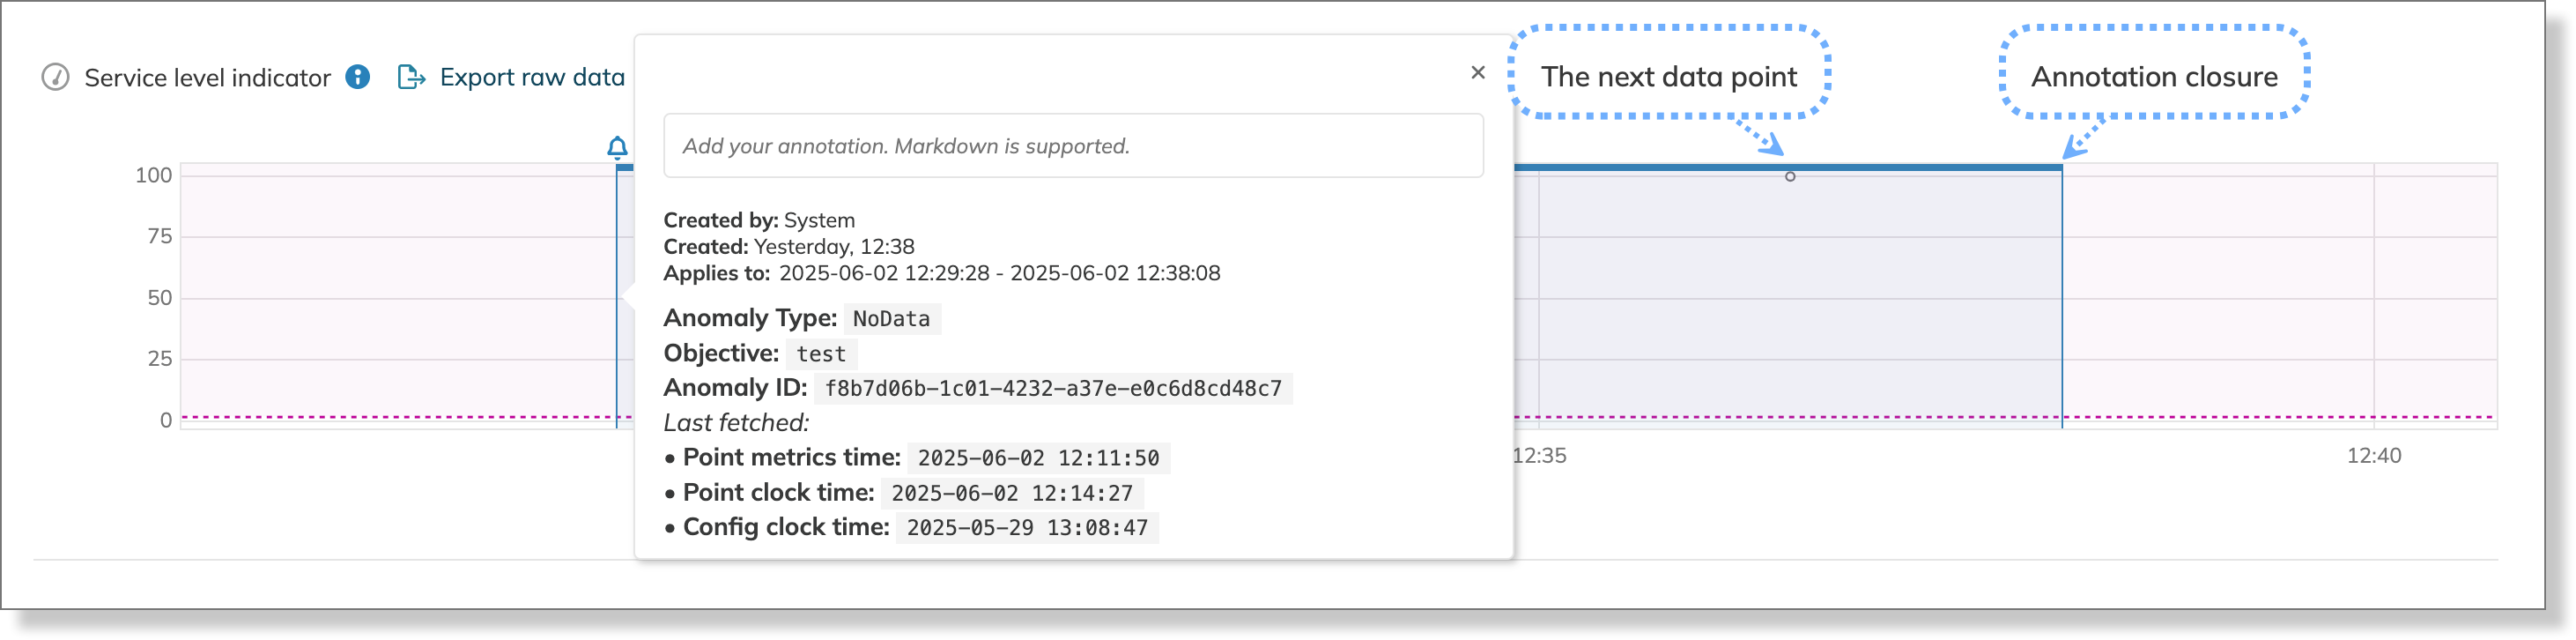
Anomaly annotation is closed after a data stream resumes -
Annotations for policy alerts are created based on the metric timestamp. These annotations represent the time when an SLI indicates that an alert was triggered or resolved. For delayed metrics, annotations added by the system relate to a past period; however, the notifications are sent when the alerts are triggered. If an alert is triggered but not yet resolved, you'll see a single annotation pin including only the
startTime, instead of a time range.annotations and alert silenceSystem annotations are created regardless of whether an alert is silenced. Nobl9 creates annotations for silenced alerts and displays them on the SLO charts.
User annotations
User annotations are added manually by users and include the following details:
- The first and last name of the user who added the annotation
- The date and time of the annotation creation
- The period the annotation relates to
- A custom description—anything the user considered necessary to note
You can annotate your SLO in the case of any outstanding event happened with your service or when any deployments or hotfixes take place.
The point of annotations is answering to the questions like:
- What caused my error budget to burn so quickly?
- Why did my SLI spike?
- When and how long was my service down?
Annotation visuals
Annotation origin is indicated by its icon. Annotations that share the same start date but have different start times are grouped. Annotations with identical start dates and times (up to the second) are treated as a single annotation.
| Annotation origin | Visual (single) | Visual (grouped) |
|---|---|---|
| User | ||
| System, budget adjustment | ||
| System, anomaly and policy alert event |

