Increasing SLO sensitivity to incidents
This guide shows how to configure an SLO to make it more sensitive to incidents. First, let’s examine how an SLO behaved during an incident and how it recovered afterward:
Burn rate and error budget
The two most important signals that SLO outputs provide are the error budget and the current burn rate. Before discussing appropriate alerting mechanisms, let’s analyze these signals during an incident.
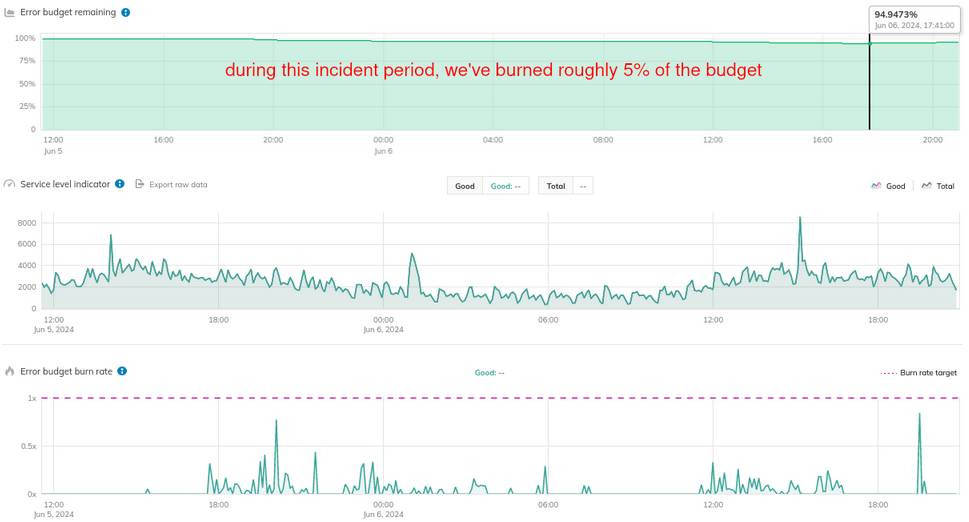
When analyzing the SLO during an active incident,
we observe that it began with nearly 20% of the error budget consumed.
Afterward, the SLO consumed less of its error budget, reaching a minimum of 0.9%.
The SLO performance then stabilized for a while, consuming about 2% of the budget over the next 9 minutes.
During these periods, the error budget burn rate consistently stayed above 1x.
While it fluctuated and spent half of the time above 1x, the error budget remained positive.
This indicates that the SLO was performing adequately and would not exhaust the entire error budget before the time window ended. For example, an average burn rate of 0.75x over the entire time window implies that 25% of the budget will remain at the end of the period.
In contrast, consider another example: a burn rate of 3x over the entire time window would mean ending with -200% of the budget at the end of the period. This would correspond to achieving 97% reliability for an SLO with a target reliability of 99%.
Pull the chart's slider to see how burn rate impacts the error budget.
SLI configuration
Let’s now switch to the current time window to assess the error budget burn rate:
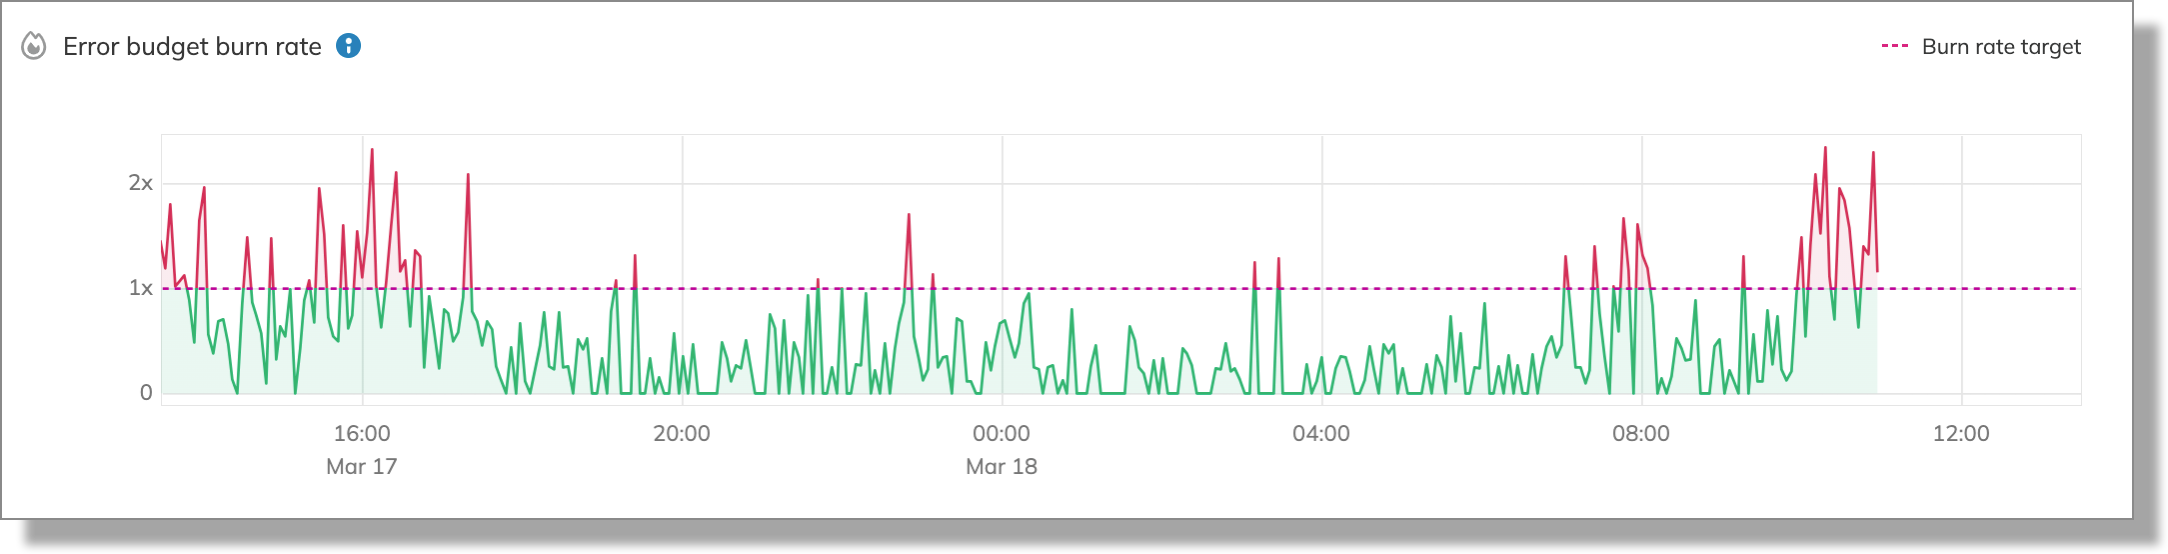
As shown above, the burn rate mostly remained under 1x.
This indicates that in our example, the SLO was never at risk of fully depleting the error budget because the burn rate stayed below 1x for most of the time.
By thoroughly understanding and validating the input signals, we can adjust this SLO to be more responsive to incidents.
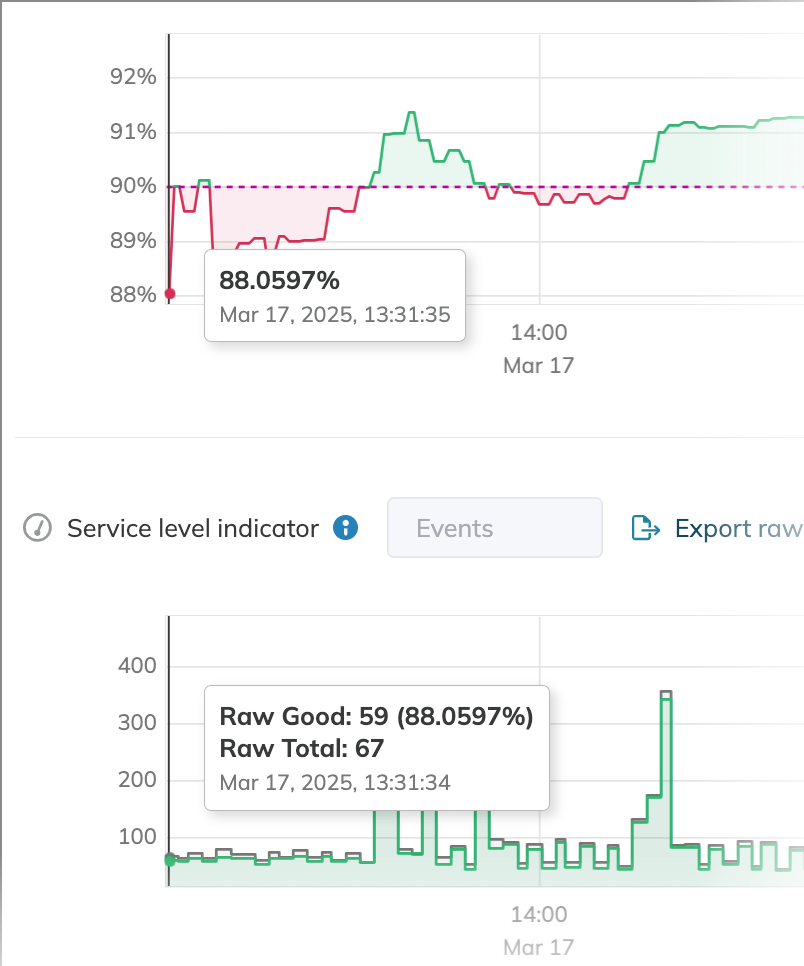
Here’s how the SLI was structured:
Query for good events:
SELECT count(*) FROM requests WHERE statusCode <> 500;
Query for total events:
SELECT count(*) FROM requests;
Here, any instance where statusCode != 500 is defined as a good event. While this approach works in theory, during the incident, a few 500 errors did not significantly impact SLO performance because of the overwhelming number of overall responses with other status codes. For instance, at 13:31:34, when the error budget consumption was at its highest, there were still 59 good data points compared to only 8 bad data points:
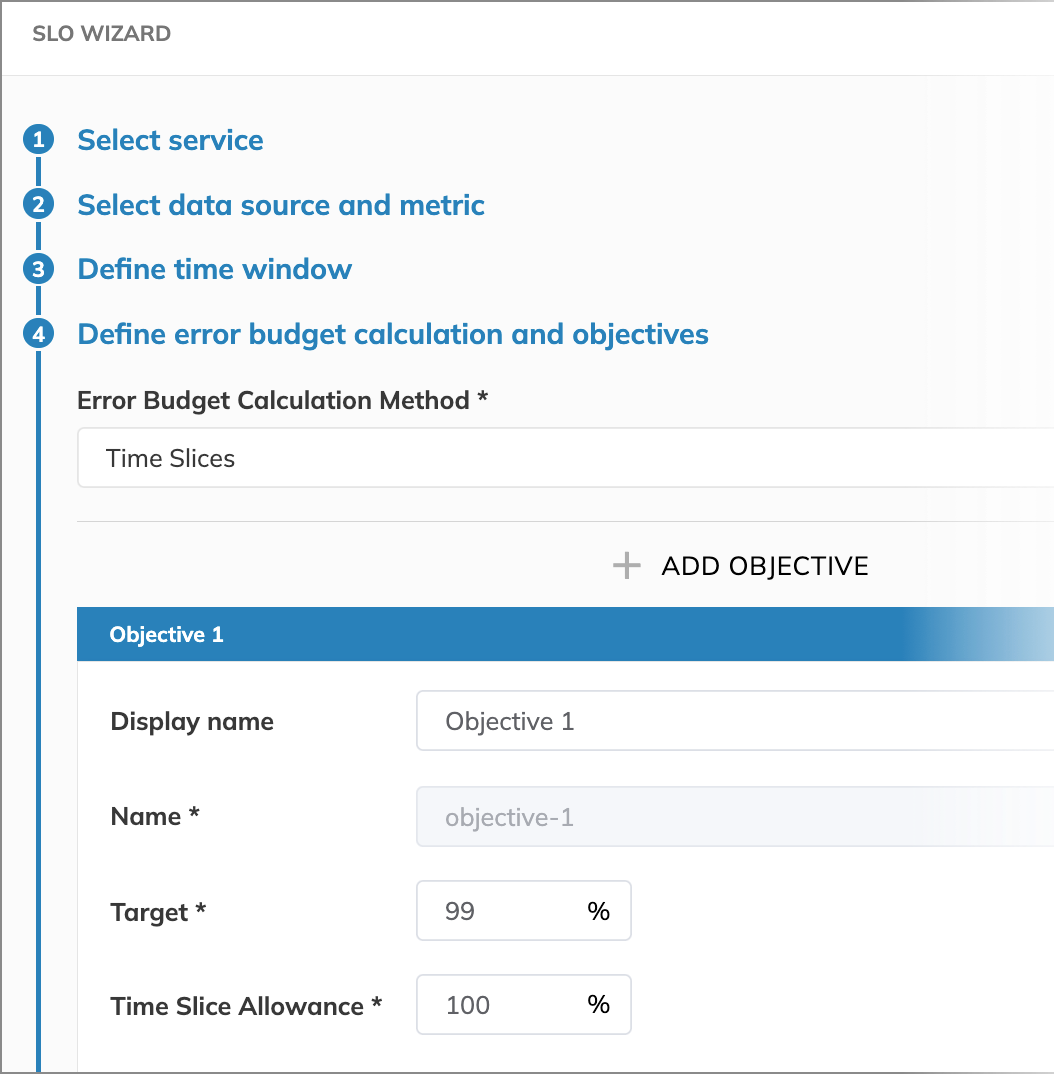
Configuring budgeting method
To make the SLO more sensitive to incidents, you can increase its ability to burn the budget during every minute of an incident. There are several approaches to achieve this. However, based on how this SLI behaves during an incident, we recommend using the time slices method instead of occurrences.
The time slices method divides the SLO time window into good and bad minutes.
For example, any minute in which a 500 status code event occurs can be marked as bad. This configuration can be achieved by setting a 100% time slice allowance.