Organization status Beta Enterprise
The Organization status
Organization status reporting is based on manually registered or auto-detected disruptions. Auto-detection considers issues flagged by users, external telemetry signals, and Nobl9 SLO alerts.
Organization status is currently in Beta for Enterprise customers. We welcome your feedback as we optimize this functionality. Breaking changes may occur in future updates to ensure the best possible performance.
Access to this feature is available on the Enterprise plan. See pricing and plans to learn more.
Prerequisites and RBAC
The following role-based access permissions are applied to the Organization status:
| Role | Access level |
|---|---|
| Organization admin | • Create and modify the component structure • Flag and delete issues • Manage disruptions • Force component statuses |
| Organization user | • View Status page • View Disruption registry • View Component details page • View Disruption details page • Flag issues |
Organization status may require the following setup elements, depending on how you want to use the feature:
| Requirement | Description | Notes | Requirement level |
|---|---|---|---|
| Mapped components | Models the structure of the monitored organization or system | Use a component hierarchy with a granularity that reflects how you want status to roll up | Mandatory |
| Nobl9 SLOs with linked alert policies | Provides options for automatic issue detection and reduces reliance on manual input | SLO alerts are sent to Organization status internally | Recommended |
| External telemetry tool integration | Brings in external issue signal to broaden auto-detection coverage | External tools can send signals through the Send issue from external telemetry API endpoint | Optional |
Core concepts and glossary
Organization status glossary:
| Term | Definition |
|---|---|
| Disruption | An unwanted event occurred to a component that led to decreased performance. |
| Disruption state | An indicator of a disruption lifecycle. Can be: • Impacting (active) • Cleared (historical record) |
| Disruption trigger | The way a disruption is detected and registered. Can be: • Auto • Manual |
| Issue | A signal that contributes to the issue threshold used to detect disruptions, representing downtime, an error, an incident, or other unexpected behavior. |
| Issue source | The way the issue was received by Organization status. Can be: • User • Nobl9 SLO • External telemetry |
| Component status | An indicator of component performance. It depends on the presence and severity of an impacting disruption. Can be: • Operational • Degraded performance • Major outage |
The Organization status section features the following core concepts:
- Component status is driven by disruptions
- Disruptions come from manual actions or issue-threshold auto-detection
- Component status propagates upstream through the component hierarchy
- Organization admins manage component structure and disruptions
Overview
The Organization status section provides real-time health monitoring for your organization's components, featuring a 90-day historical view. It can be configured to mirror your organizational structure through a nested hierarchy.
Core interface components:
- Status page is a high-level, real-time health monitoring surface providing visibility into current system state and 90-day historical health trends.
- Impact monitor Admin accessis a dedicated view for tracking components impacted by disruptions and issues. It provides a breakdown of issues and displays statistics on impacted components.
- Component map Admin accessis an administrative tool used to build and manage the hierarchical structure of your organization components and subcomponents.
Status page
Status page is the main real-time view in Organization status. It shows the status of your organization’s components, highlights active disruptions, and provides a 90-day history so teams can quickly assess operational status and track changes over time.
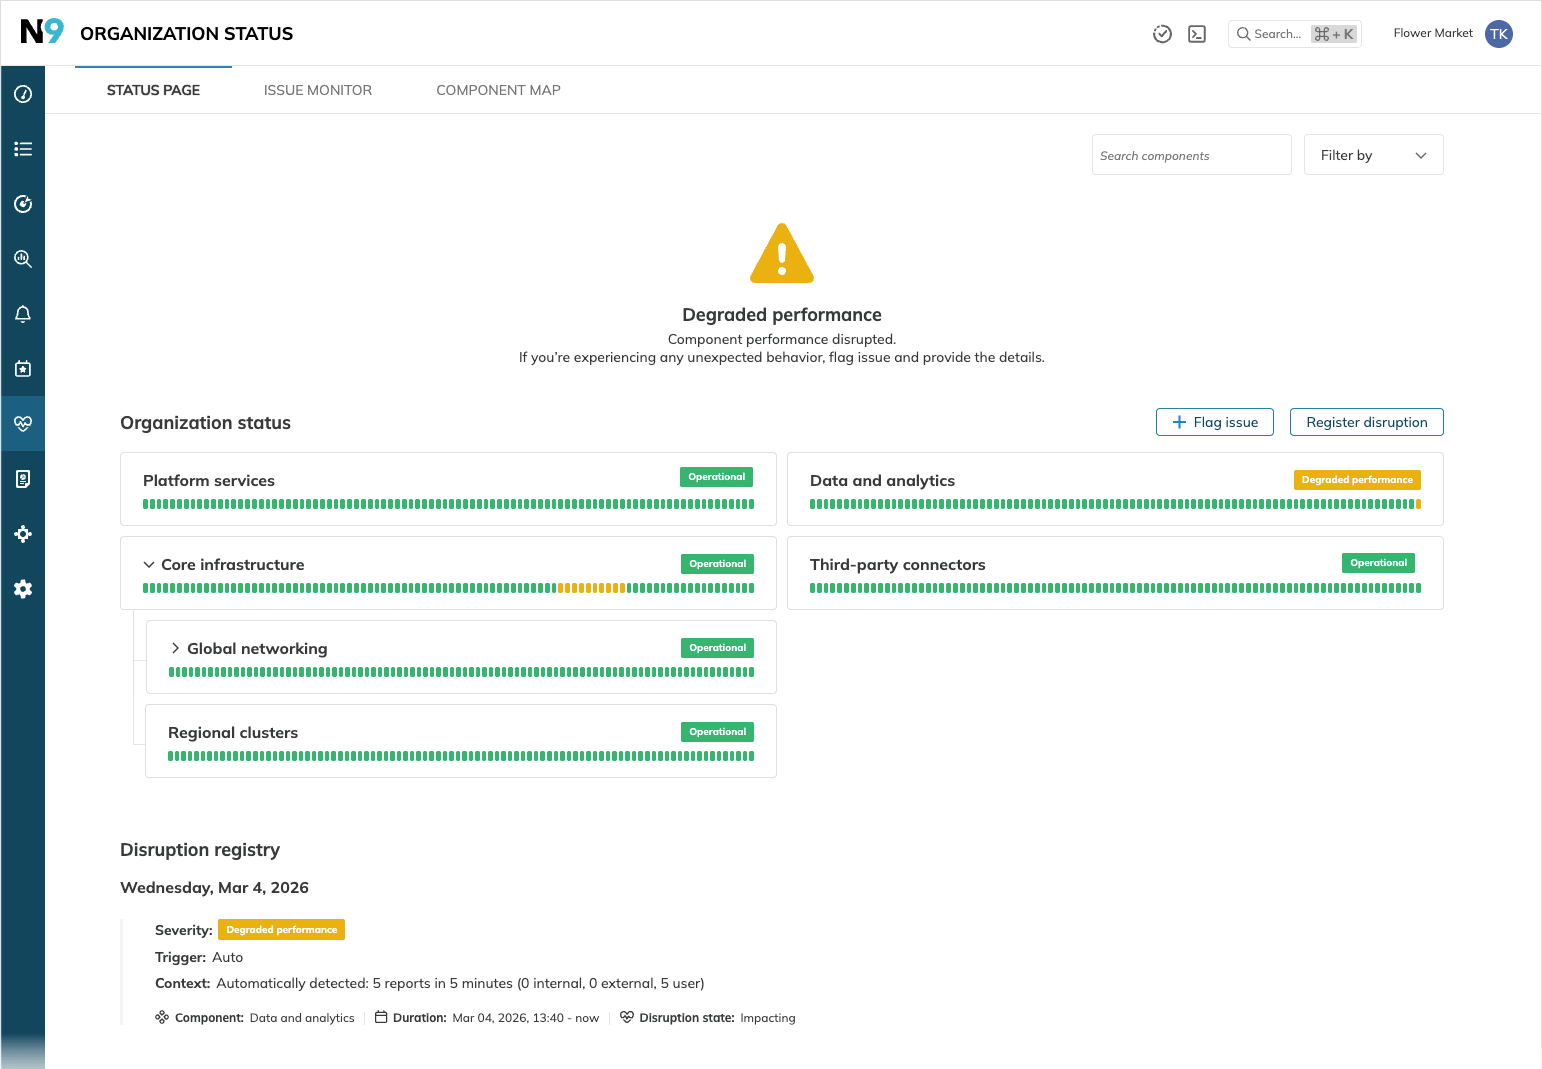
- Overall status: the most critical status across all organization components.
- Component timeline: a 90-day status per component. It propagates subcomponent statuses upwards, reflecting the most critical of all.
- Disruption registry: the journal of all disruptions registered in components, displaying up to the 100 most recent disruptions.
The following view and interaction options are available on the Status page:
| Option | Description | Access level |
|---|---|---|
| Search and filter | Locate specific components by name, status, or labels | Any |
| View component details | Access deep-dive information for a specific component | Any |
| + Flag issue | Submit a performance issue for a component to contribute toward its auto-detection threshold | Any |
| Register disruption | Manually force a component into a Degraded or Major outage status | Organization admin |
| View disruption details | Access deep-dive information for a specific disruption. Available on hover over the disruption's row in Disruption registry. | Any |
| Clear disruption | Conclude an impacting disruption to return the component to the Operational status. Available on hover over the disruption's row in Disruption registry. | Organization admin |
Disruption reporting
The system automatically transitions component statuses from Operational to an impacted status based on registered disruptions.
- Auto-detection thresholds
Disruptions with the Degraded performance severity are registered when issues, aggregated in 5-minute intervals, exceed specific thresholds. While these are customizable, the defaults are:- Five issues in 5 minutes for user flags and external telemetry
- Two issues in 5 minutes for SLO alerts
- Manual registration Admin access
Organization admins can register disruptions manually as Degraded performance or Major outage, or escalate impacting auto-detected disruptions to Major outage.
| Status | Description | Disruption severity | Result of |
|---|---|---|---|
| Operational | Components are properly monitored. No disruptions are reported. | No disruption | Manual clearance or deletion |
| Degraded performance | Some components are impacted by disruptions. | Degraded performance | Auto or manual |
| Major outage | Significant disruption in components. | Major outage | Manual |
The No signal badge next to No SLO alerts indicates that the component lacks linked SLOs with an attached alert policy.
Such a component cannot receive issues from SLO alerts, so the system cannot confidently confirm the Operational status. However, it can still display Degraded performance or Major outage if disruptions are auto-detected or registered manually.
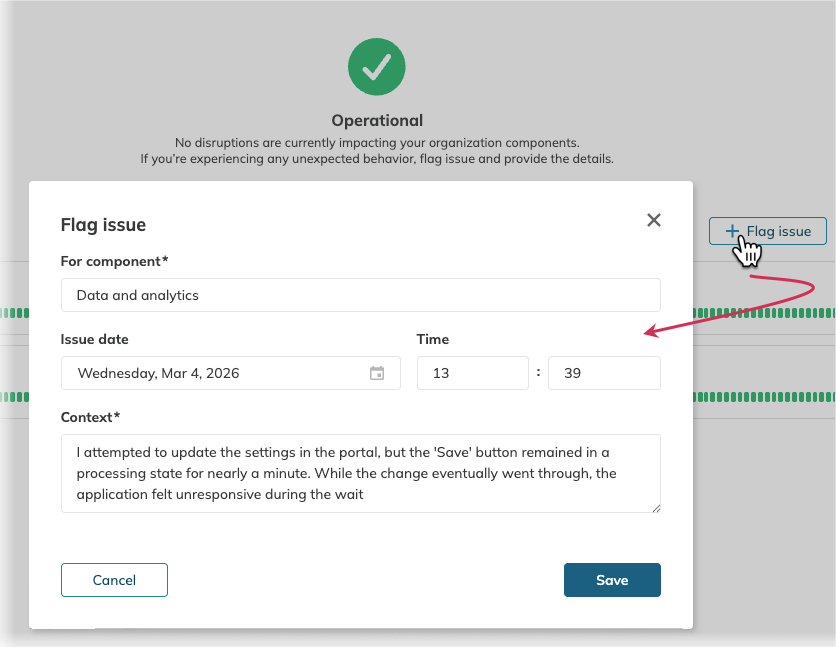
Flagging issues
Any user with Organization status access can manually flag an issue for a component. Manual flags contribute to the issue threshold.
- Go to the Status page or a component details page.
- Click + Flag issue.
- Select the impacted component and optionally modify the timing and provide context.
- Click Flag issue to save.
All issues received by the status page appear under the Impact monitor tab, in the appropriate tile and in the Latest issues table.
Component details
The component details page provides a deep dive into a specific component's health, combining real-time data with the 90-day status timeline for historical context.
To access a component details page, click the component name on the Status page.
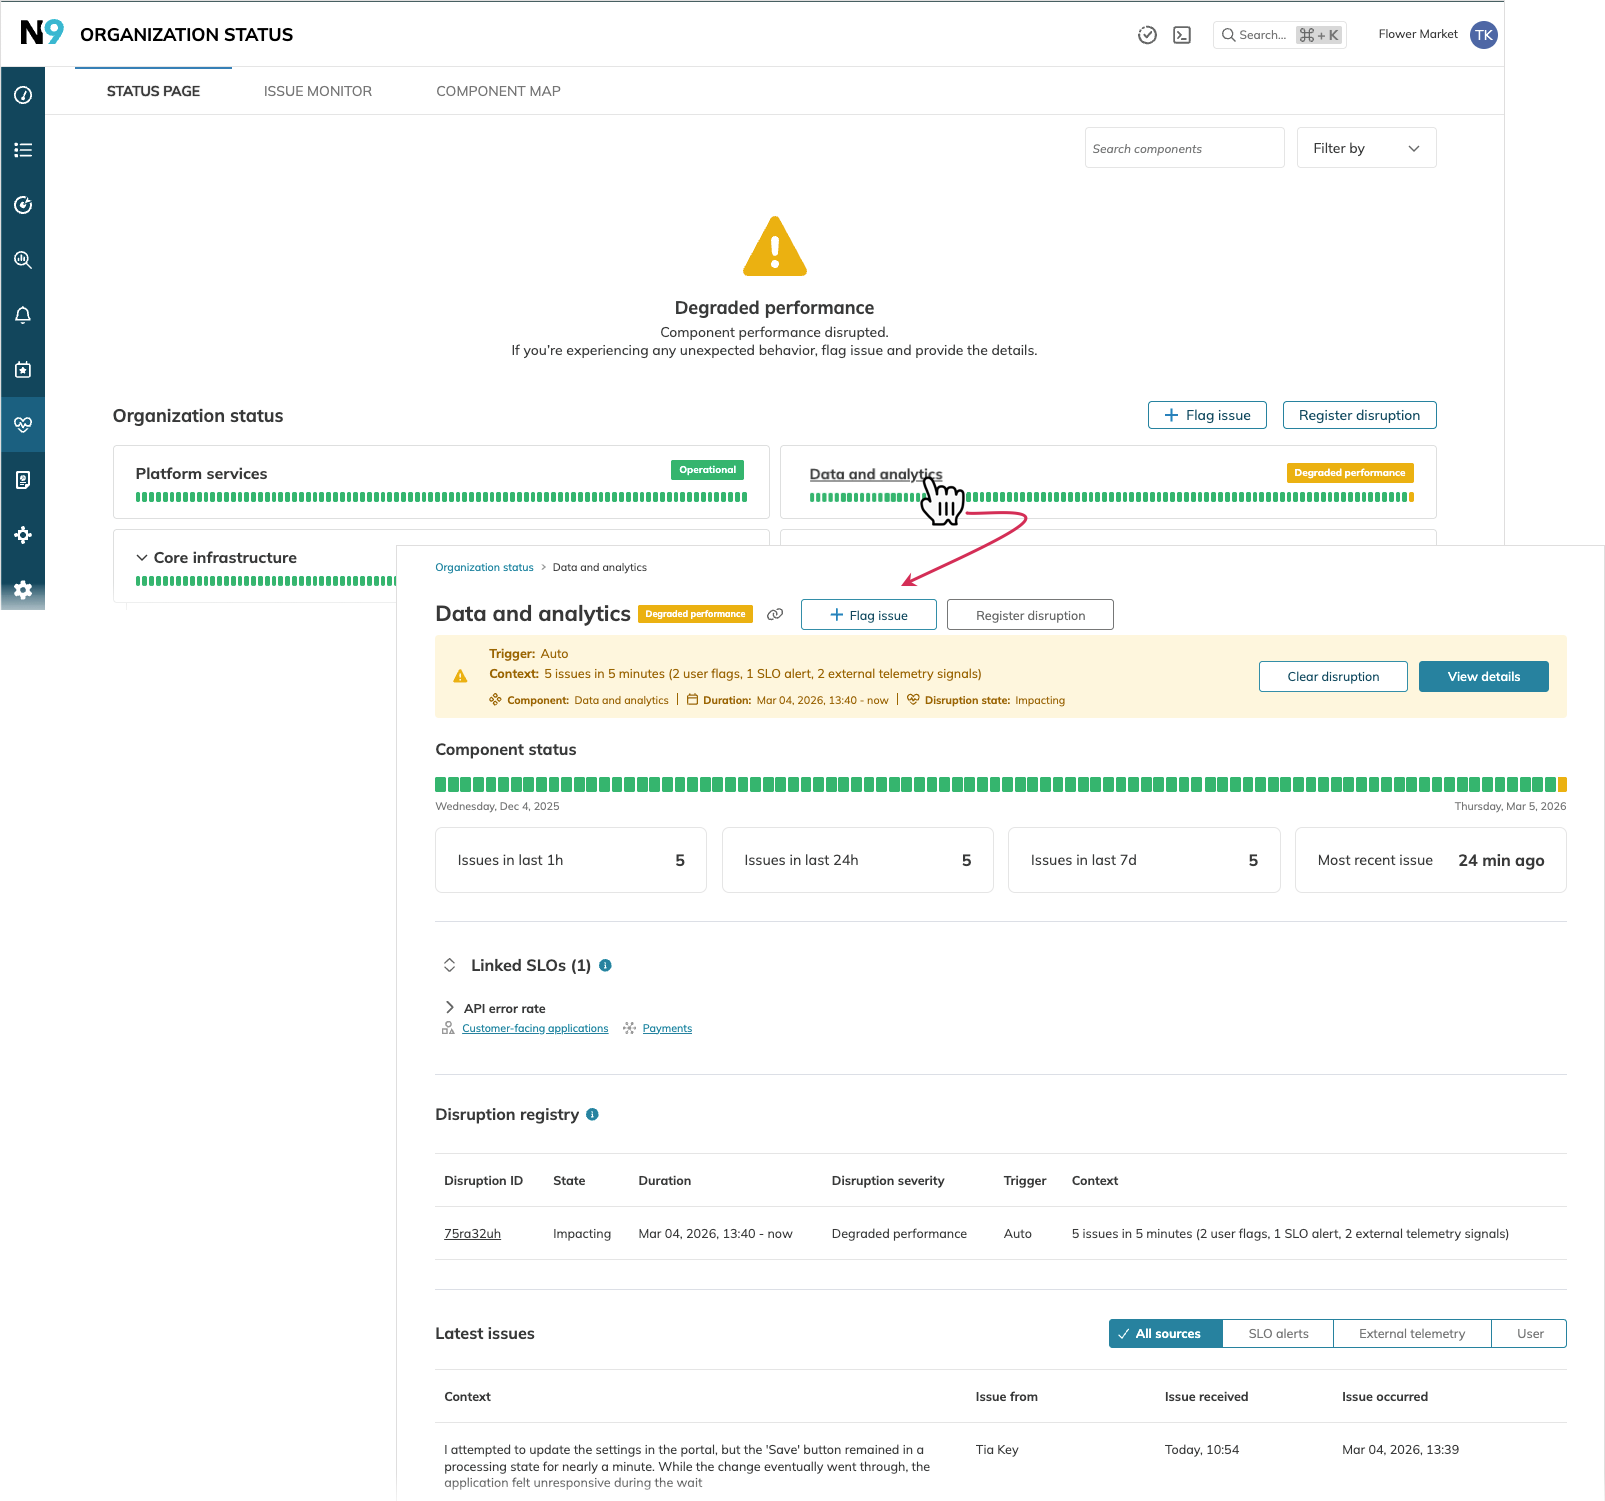
Each page includes:
- Identity and impact
- Component name and description
- Time-based issue volume breakdowns
- 90-day component status timeline
- Operational controls
- Flag an issue to manually submit an issue for the component
- Register disruption (Admin-only) to manually force a status change; this option is inactive if the component has an impacting disruption
- Disruption summary (if any)
- An impacting disruption summary with options to Clear disruption (Admin-only) and View details
- Disruption registry—a chronological journal of all historical disruptions for this component
- Impact sources
- Latest issues—a table of issues related to this component
- Linked SLOs—the list of SLOs linked to this component
Disruption details
To analyze a disruption, click View details next to the required disruption. This opens the disruption details page.
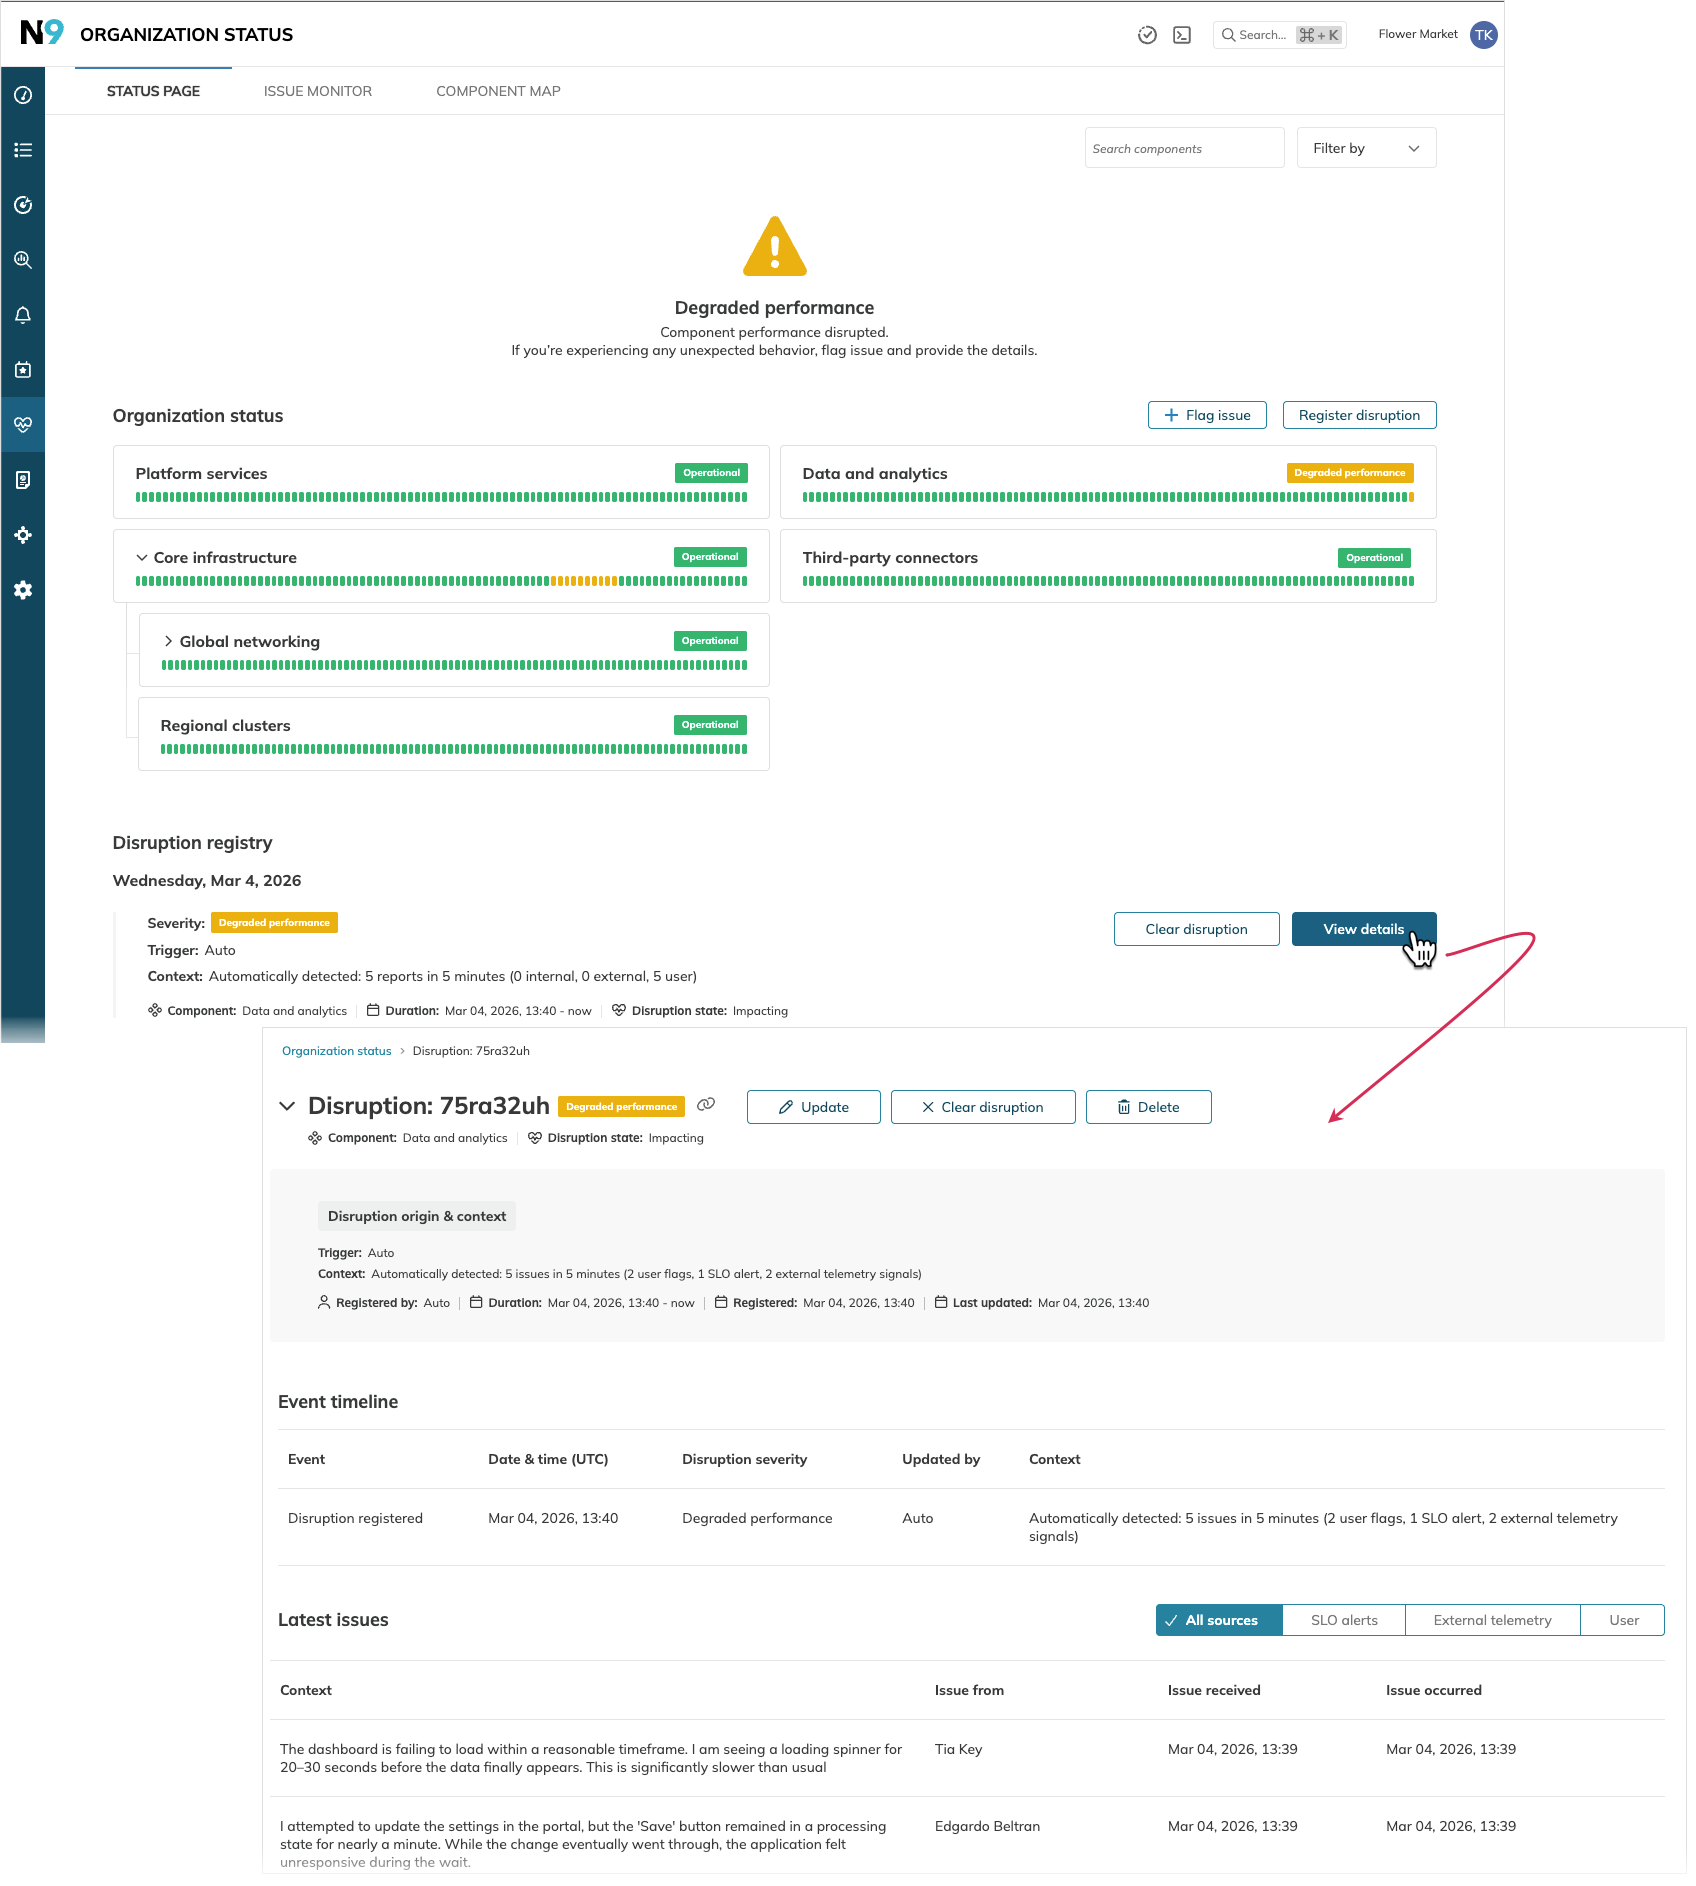
The disruption details page provides the following information:
- Disruption ID is automatically assigned when the disruption is registered.
- Disruption severity
- Impact and state information:
- Impacted component name—the one impacted directly
- Upstream impact with any parent component names that contain the component that is impacted directly
- Disruption state—impacting or cleared
- Disruption context and attributes:
- Trigger type—auto (automatically generated when the threshold is exceeded) or manual (manually registered by the admin)
- For manual triggers—who registered the disruption
- Disruption duration
- When the disruption was registered and last updated
- The Event timeline table provides the following details for events that happened to this disruption:
- Event identifier
- Time of the event
- Disruption severity
- A user who updated the disruption or System for automated updates
- The disruption context at the moment the event took place
- The Latest issues table shows the issues that contributed to this disruption.
- Issue context
- Issue from: The issue origin—the first and last name of the user who flagged this issue, System, or SLO alert
- Issue received: When the issue was received by the status page
- Issue occurred: When the issue actually occurred

