Burn rate calculations
Burn rate is a metric used to measure how fast you're burning your error budget.
1, you're burning through your budget at an acceptable rate. Having a burn rate equal to 1 over an SLO's whole time window duration is effectively the same as starting from 100% of the remaining error budget and reaching 0% at the end of the time window.1 means that with the current rate of errors, you'll most likely retain some of your error budget at the end of the time window.1 means you're using your error budget too quickly. This can result in the budget being exhausted before the time window ends.You can play around with different values of burn rate to see how it affects the error budget.
The example above assumes the burn rate has the same value over the entire time window, which is not the case in most real-life scenarios.
Burn rate evaluation window
Every time Nobl9 evaluates a burn rate, it is done in the context of some time frame. For example, consider the following diagram of an error budget chart:
We can evaluate the rate at which we're using up our error budget at any given point, but the outcome will vary depending on the time frame we use to evaluate it. For example, a burn rate evaluated over the first half of the time window might show a slow but stable burn rate.
In such cases, expect to see values greater than 1x. This is because when the burn rate is lower than 1x, it indicates that the error budget is being exhausted in a stable manner, but you won't exhaust the entire budget by the end of SLO's time window.
On the other hand, evaluating the burn rate over the next segment of the time window might show a burn rate lower than 1x or even negative values, indicating that the error budget is recovering.
This can happen for (SLOs) with rolling time windows and bad events no longer within the window. It can also take place in SLOs configured with the occurrences method reporting a constant number of bad events but an increasing number of good events in the evaluated time window.
Finally, evaluating the burn rate over the last segment of the time window might show a fast burn rate. This indicates that your service is burning the error budget faster than it should. In such cases, expect values for burn rate ≥ 10x (naturally, this is subjective as some users might consider 5x a fast burn rate).
Burn rate evaluation and alerting windows
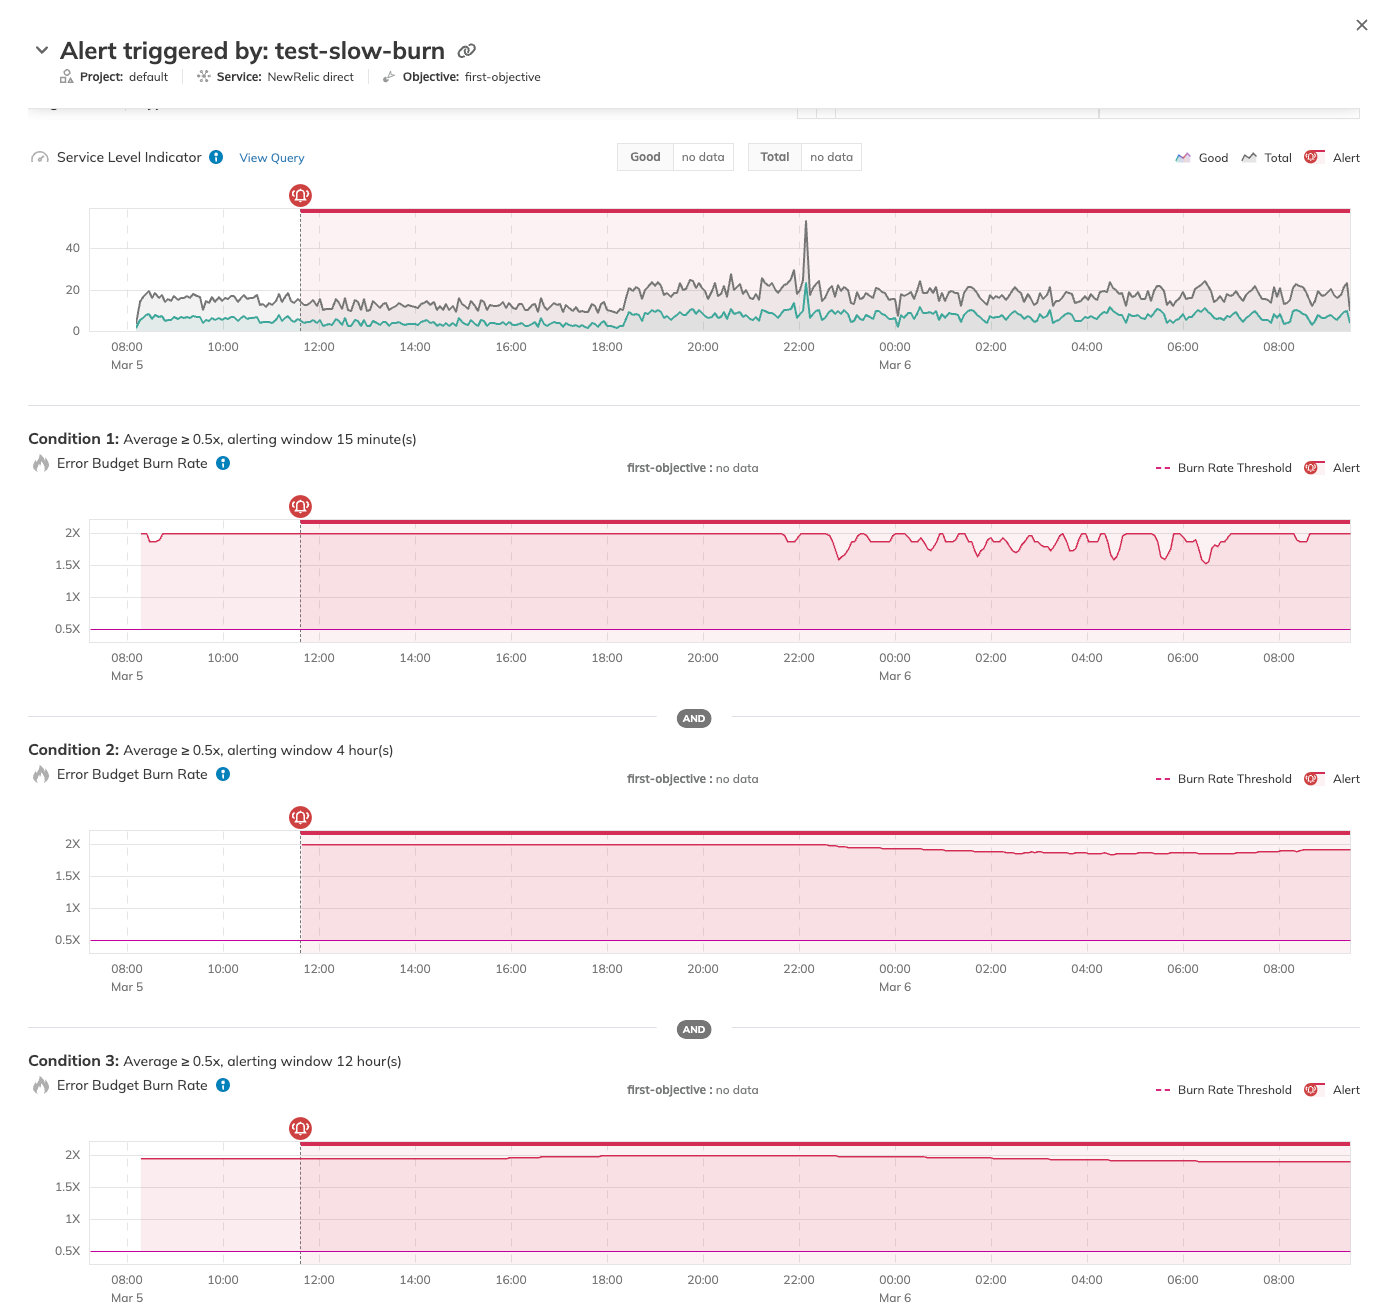
You can configure the duration over which the burn rate is evaluated using the alertingWindow parameter.
The smaller the alerting window, the more "spiky" burn rate is; with that, alerts are likely to be triggered more often. Smaller windows are useful for detecting short but significant burns over a shorter period, which often indicates an incident that requires immediate attention.
On the other hand, longer alerting windows are better at detecting a global trend. You can use them to ensure the SLO meets its target at the end of its time window.

If you aren't sure what values of burn rate and alerting window you should use in your alert policies, Nobl9 offers alert presets as a way to quickly set up your first fast- and slow-burn policies.
YAML configuration
The following YAML defines AlertPolicy with a Burn rate condition:
apiVersion: n9/v1alpha
kind: AlertPolicy
metadata:
  name: fast-burn
  project: default
spec:
  alertMethods: []
  conditions:
  - alertingWindow: 5m
    measurement: averageBurnRate
    value: 20
    op: gte
  coolDown: 5m
  description: "Policy that triggers when the average burn rate based based on the last 5 minutes is greater than or equal to 20x"
  severity: High
Check if the defined alert condition has the alertingWindow attribute (for example, by checking its YAML configuration through the sloctl get alertpolicies [alert_policy_name]). It is possible to create a similar alert policy, but with the lastsFor value defined instead.
However, we recommend configuring the burn rate policy with the alertingWindow parameter, allowing more control over the evaluation window and providing more precise calculations.