ServiceNow Cloud Observability (formerly Lightstep)
ServiceNow Cloud Observability (formerly Lightstep) features distributed tracing that can be used to rapidly pinpoint the causes of failures and poor performance across the deeply complex dependencies among services, teams, and workloads in modern production systems. Nobl9 integration with ServiceNow Cloud Observability facilitates organizations to establish service level objectives from performance data captured through distributed traces in the ServiceNow Cloud Observability platform.
Scope of support
ServiceNow Cloud Observability parameters and supported features in Nobl9
- General support:
- Release channel: Stable,
Beta
- Connection method: Agent, Direct
- Replay and SLI Analyzer: Historical data limit 30 days
- Event logs: Supported
- Query checker: Not supported
- Query parameters retrieval: Supported
- Timestamp cache persistence: Supported
- Connection method: Agent, Direct
- Query parameters:
- Query interval: 1 min
- Query delay: 2 min
- Jitter: 15 sec
- Timeout: 30 sec
- Query delay: 2 min
- Agent details and minimum required versions for supported features:
- Plugin name: n9lightstep
- Query delay environment variable: LS_QUERY_DELAY
- Replay and SLI Analyzer: 0.65.0
- Query parameters retrieval: 0.73.2
- Timestamp cache persistence: 0.65.0
- Query delay environment variable: LS_QUERY_DELAY
You can configure Nobl9 SLOs with ServiceNow Cloud Observability as follows:
- Threshold metrics:
- UQL:
constant,metrics, andspansquery types - Latency Threshold
- Error Threshold
- UQL:
- Ratio metrics:
- UQL:
constant,metrics, andspansquery types - Error Ratio
- UQL:
No support for spans_sample and assemble UQL queries.
Creating SLOs with ServiceNow Cloud Observability
Nobl9 Web
Follow the instructions below to create your SLOs with ServiceNow Cloud Observability on the Nobl9 Web:
- Navigate to Service Level Objectives.
- Click
 .
. - Select a Service.
It will be the location for your SLO in Nobl9. - Select your ServiceNow Cloud Observability data source.
- Modify Period for Historical Data Retrieval, if necessary.
- Defines the furthest point in the past from which data can be retrieved when replaying your ServiceNow Cloud Observability SLO.
- A longer period can extend the data loading time for your SLO.
- Must be a positive whole number up to the maximum period value you've set when adding the ServiceNow Cloud Observability data source.
Non-editable Replay periodNon-editable Replay period indicates that the maximum period for historical data retrieval set for your ServiceNow Cloud Observability data source is set to zero.
Adjust the data source settings to create the SLO with Replay. - Metric refers to the way of calculating and interpreting data from your data source.
- Threshold metric is defined by a single numerical value (the threshold) that separates satisfactory performance from unsatisfactory performance. It's represented by a single time series evaluated against the threshold.
- Ratio metric expresses the performance as a fraction or proportion, typically by dividing the number of successful events by the total number of potential events (successes + failures). It's represented by two-time series for comparison for good events and total events.
For ratio metrics, select the Data count method.SLI values for good and totalWhen choosing the query for the ratio SLI (countMetrics), keep in mind that the values resulting from that query for both good and total:- Must be positive.
- While we recommend using integers, fractions are also acceptable.
- If using fractions, we recommend them to be larger than
1e-4=0.0001. - Shouldn't be larger than
1e+20.
- Threshold metric
- Ratio metric
constant, metrics, and spans data.constant, metrics, and spans data.ServiceNow Cloud Observability does not recognize the distinction between missing data and valid data with a 0 value in the stream. In such cases, ServiceNow Cloud Observability considers these values equal and returns the 0 value.
- Define the Time window for your SLO:
- Rolling time windows constantly move forward as time passes. This type can help track the most recent events.
- Calendar-aligned time windows are usable for SLOs intended to map to business metrics measured on a calendar-aligned basis.
- Configure the Error budget calculation method and Objectives:
- Occurrences method counts good attempts against the count of total attempts.
- Time Slices method measures how many good minutes were achieved (when a system operates within defined boundaries) during a time window.
- You can define up to 12 objectives for an SLO.
Similar threshold values for objectivesTo use similar threshold values for different objectives in your SLO, we recommend differentiating them by setting varying decimal points for each objective.
For example, if you want to use threshold value1for two objectives, set it to1.0000001for the first objective and to1.0000002for the second one. - Add the Display name, Name, and other settings for your SLO:
- Name identifies your SLO in Nobl9. After you save the SLO, its name becomes read-only.
Use only lowercase letters, numbers, and dashes. - Select No data anomaly alert to receive notifications when your SLO stops reporting data for a specified period:
- Choose up to five supported Alert methods.
- Specify the delay period before Nobl9 sends an alert about the missing data.
From 5 minutes to 31 days. Default: 15 minutes
- Add alert policies, labels, and links, if required.
Limits per SLO: 20 alert policies or links, 30 labels.
- Name identifies your SLO in Nobl9. After you save the SLO, its name becomes read-only.
- Click CREATE SLO
YAML
- Metrics threshold
- Latency threshold
- Error threshold
- Metrics ratio
- Error ratio
Here’s an example of ServiceNow Cloud Observability using rawMetric (threshold metric) with Metrics as the configuration type:
apiVersion: n9/v1alpha
kind: SLO
metadata:
  name: api-server-slo
  displayName: API Server SLO
  project: default
  labels:
    area:
      - latency
      - slow-check
    env:
      - prod
      - dev
    region:
      - us
      - eu
    team:
      - green
      - sales
  annotations:
    area: latency
    env: prod
    region: us
    team: sales
spec:
  description: Example Lightstep SLO
  indicator:
    metricSource:
      name: lightstep
      project: default
      kind: Agent
  budgetingMethod: Occurrences
  objectives:
    - displayName: Good response (200)
      value: 200.0
      name: ok
      target: 0.95
      rawMetric:
        query:
          lightstep:
            typeOfData: metric
            uql: metric cpu.utilization | rate | group_by [], mean
      op: lte
      primary: true
  service: api-server
  timeWindows:
    - unit: Month
      count: 1
      isRolling: false
      calendar:
        startTime: "2022-12-01 00:00:00"
        timeZone: UTC
  alertPolicies:
    - fast-burn-5x-for-last-10m
  attachments:
    - url: https://docs.nobl9.com
      displayName: Nobl9 Documentation
  anomalyConfig:
    noData:
      alertMethods:
        - name: slack-notification
          project: default
      alertAfter: 1h
Here’s an example of ServiceNow Cloud Observability using rawMetric (threshold metric) with Latency threshold as the configuration type:
apiVersion: n9/v1alpha
kind: SLO
metadata:
  name: api-server-slo
  displayName: API Server SLO
  project: default
  labels:
    area:
      - latency
      - slow-check
    env:
      - prod
      - dev
    region:
      - us
      - eu
    team:
      - green
      - sales
  annotations:
    area: latency
    env: prod
    region: us
    team: sales
spec:
  description: Example Lightstep SLO
  indicator:
    metricSource:
      name: lightstep
      project: default
      kind: Agent
  budgetingMethod: Occurrences
  objectives:
    - displayName: Good response (200)
      value: 200.0
      name: ok
      target: 0.95
      rawMetric:
        query:
          lightstep:
            streamId: DzpxcSRh
            typeOfData: latency
            percentile: 95.0
      op: lte
      primary: true
  service: api-server
  timeWindows:
    - unit: Month
      count: 1
      isRolling: false
      calendar:
        startTime: "2022-12-01 00:00:00"
        timeZone: UTC
  alertPolicies:
    - fast-burn-5x-for-last-10m
  attachments:
    - url: https://docs.nobl9.com
      displayName: Nobl9 Documentation
  anomalyConfig:
    noData:
      alertMethods:
        - name: slack-notification
          project: default
      alertAfter: 1h
Here’s an example of ServiceNow Cloud Observability using rawMetric (threshold metric) with Error threshold as the configuration type:
apiVersion: n9/v1alpha
kind: SLO
metadata:
  name: api-server-slo
  displayName: API Server SLO
  project: default
  labels:
    area:
      - latency
      - slow-check
    env:
      - prod
      - dev
    region:
      - us
      - eu
    team:
      - green
      - sales
  annotations:
    area: latency
    env: prod
    region: us
    team: sales
spec:
  description: Example Lightstep SLO
  indicator:
    metricSource:
      name: lightstep
      project: default
      kind: Agent
  budgetingMethod: Occurrences
  objectives:
    - displayName: Good response (200)
      value: 200
      name: ok
      target: 0.95
      rawMetric:
        query:
          lightstep:
            streamId: DzpxcSRh
            typeOfData: error_rate
      op: lte
      primary: true
  service: api-server
  timeWindows:
    - unit: Month
      count: 1
      isRolling: false
      calendar:
        startTime: '2022-12-01 00:00:00'
        timeZone: UTC
  alertPolicies:
    - fast-burn-5x-for-last-10m
  attachments:
    - url: https://docs.nobl9.com
      displayName: Nobl9 Documentation
  anomalyConfig:
    noData:
      alertMethods:
        - name: slack-notification
          project: default
      alertAfter: 1h
Here’s an example of ServiceNow Cloud Observability using countMetrics (ratio metric) with Metrics as the configuration type:
apiVersion: n9/v1alpha
kind: SLO
metadata:
  name: api-server-slo
  displayName: API Server SLO
  project: default
  labels:
    area:
      - latency
      - slow-check
    env:
      - prod
      - dev
    region:
      - us
      - eu
    team:
      - green
      - sales
  annotations:
    area: latency
    env: prod
    region: us
    team: sales
spec:
  description: Example Lightstep SLO
  indicator:
    metricSource:
      name: lightstep
      project: default
      kind: Agent
  budgetingMethod: Occurrences
  objectives:
    - displayName: Good response (200)
      value: 1.0
      name: ok
      target: 0.95
      countMetrics:
        incremental: false
        good:
          lightstep:
            typeOfData: metric
            uql: metric cpu.utilization | rate | group_by [], mean
        total:
          lightstep:
            typeOfData: metric
            uql: metric cpu.utilization | rate | group_by [], max
      primary: true
  service: api-server
  timeWindows:
    - unit: Month
      count: 1
      isRolling: false
      calendar:
        startTime: "2022-12-01 00:00:00"
        timeZone: UTC
  alertPolicies:
    - fast-burn-5x-for-last-10m
  attachments:
    - url: https://docs.nobl9.com
      displayName: Nobl9 Documentation
  anomalyConfig:
    noData:
      alertMethods:
        - name: slack-notification
          project: default
      alertAfter: 1h
Here’s an example of ServiceNow Cloud Observability using countMetrics (ratio metric) with Error ratio as the configuration type:
apiVersion: n9/v1alpha
kind: SLO
metadata:
  name: api-server-slo
  displayName: API Server SLO
  project: default
  labels:
    area:
      - latency
      - slow-check
    env:
      - prod
      - dev
    region:
      - us
      - eu
    team:
      - green
      - sales
  annotations:
    area: latency
    env: prod
    region: us
    team: sales
spec:
  description: Example Lightstep SLO
  indicator:
    metricSource:
      name: lightstep
      project: default
      kind: Agent
  budgetingMethod: Occurrences
  objectives:
    - displayName: Good response (200)
      value: 1
      name: ok
      target: 0.95
      countMetrics:
        incremental: false
        good:
          lightstep:
            streamId: DzpxcSRh
            typeOfData: good
        total:
          lightstep:
            streamId: DzpxcSRh
            typeOfData: total
      primary: true
  service: api-server
  timeWindows:
    - unit: Month
      count: 1
      isRolling: false
      calendar:
        startTime: '2022-12-01 00:00:00'
        timeZone: UTC
  alertPolicies:
    - fast-burn-5x-for-last-10m
  attachments:
    - url: https://docs.nobl9.com
      displayName: Nobl9 Documentation
  anomalyConfig:
    noData:
      alertMethods:
        - name: slack-notification
          project: default
      alertAfter: 1h
Click to open field reference
| Field | Type | Description |
|---|---|---|
apiVersion Mandatory | string | API version. Use n9/v1alpha |
kind Mandatory | string | The resource type. Use SLO |
| Metadata | ||
metadata.name Mandatory | string | Name identifier for the SLO. Use only lowercase alphanumeric characters |
metadata.displayName | string | User-friendly SLO name |
metadata.project Mandatory | string | The name identifier of the project where you need to host your SLO |
metadata.labels | object (map: string[]) | Grouping labels for filtering or viewing |
metadata.annotations | object (map: string) | Flat string annotations |
| Spec | ||
spec.description | string | SLO description |
spec.indicator.metricSource.name Mandatory | string | Data source name |
spec.indicator.metricSource.project Mandatory | string | Project containing the data source |
spec.indicator.metricSource.kind Mandatory | string | Data source connection method. Can be Agent or Direct |
spec.budgetingMethod Mandatory | enum | Error budget calculation method. Can be Occurrences or Time slices |
spec.objectives Mandatory | array | Your SLO objective definition, up to 12 objectives per SLO. |
spec.objectives[].displayName | string | User-friendly objective name |
spec.objectives[].value Mandatory | number | Data point values that is considered "good" (e.g., 200.0).In SLOs with two or more objectives, keep each objective's value unique. In ratio ( count) metrics, value is retained for legacy purposes. |
spec.objectives[].name Mandatory | string | Name identifier for this objective |
spec.objectives[].op Mandatory | string (enum) | Operator for objective. One of:lte (less than or equal to)lt (less than)gte (greater than or equal to)gt (greater than) |
spec.objectives[].target Mandatory | float | The percentage of the good minutes or occurrences that must meet the desired performance (e.g., is the target is 0.95, the good performance is expected to be observed in at least 95% of the time window) |
spec.objectives[].rawMetric/.countMetric Mandatory | object | The metric type indicator. Set:rawMetric for a threshold metriccountMetric for a ratio metric.A ratio metric requires the additional fields: countMetric.incremental (boolean) the data count methodcountMetric.good/.bad and countMetric.total a numerator and denominator queries |
spec.objectives[].countMetric.incremental Mandatory | boolean | The data count method for a ratio (countMetric) metric type |
spec.objectives[].primary | boolean | The indicator of a primary SLO objective |
spec.service Mandatory | string | The name identifier of a service to host this SLO. The service must exist in the project specified in metadata.project |
spec.timeWindows Mandatory | array | Defines SLO time window for error budget calculation. Set: isRolling: true for the rolling time window typeisRolling: false for the calendar-aligned type |
spec.timeWindows.unit Mandatory | integer | The time window units. One of:Day | Hour | Minute for the rolling time windowYear | Quarter | Month | Week | Day for the calendar-aligned time window |
spec.timeWindows.count Mandatory | integer | The number of units in a time window |
spec.timeWindows.startTime | string | Mandatory for calendar-aligned time windows. Date and time in the format YYYY-MM-DDTHH:mm:ss |
spec.timeWindows.timeZone | string | Mandatory for calendar-aligned time-windows. A valid IANA Time Zone Database name |
spec.timeWindows.isRolling Mandatory | boolean | true for the rolling time window typefalse for the calendar-aligned type |
spec.alertPolicies | array | The name identifiers of alert policies to be linked to this SLO (must be from the same project as the SLO). Up to 20 alert policies per SLO. |
spec.attachments | array | Links to any additional attributes of this SLO |
spec.anomalyConfig | object | Settings for a manual no data anomaly detection rule |
spec.noData.alertMethods | array | List of alert methods for no-data anomaly. Up to five alert methods per SLO. Every alert method must have the name and project fields |
spec.noData.alertAfter | string | Waiting time before sending a no-data notification. Must be 5m to 31d.Default: 15m |
| Source-specific fields | ||
lightstep.typeOfDataMandatory | string | Data selection. One of: metric | latency | error_rate (for Error threshold) | good and total (for Error ratio) |
lightstep.uqlMandatory | string | Your ServiceNow Cloud Observability UQL query required for the metric queries |
lightstep.streamIdMandatory | string | Your required metric stream identifier required for the latency and metric queries |
lightstep.percentileMandatory | string | A latency percentile required for the latency queries. Must be greater than 0 and less than or equal to 99.99 |
Query requirements
- Ratio metric always uses the non-incremental data count method. This requires specifying
incremental: falseforspec.objectives.countMetricsin your ratio SLO YAML. - The type of data you can query includes metric, latency, and error rate.
Table: Available types of data
| Type of data | Threshold or ratio metric | Description |
|---|---|---|
| Metric | Both | A UQL-formatted constant, metrics, or spans query. |
| Latency | Threshold | The n-th percentile of latency in milliseconds. |
| Error | Both | • Threshold metric: a single value representing the percentage of errors. Requires the objective value to be between 0 and 1. The error threshold is defined by typeOfData: error_rate• Ratio metric: a ratio between successful and all events or operations. The error ratio is defined by typeOfData: good and typeOfData: total. |
- Depending on the type of data, the query may require the UQL, Stream ID, or Percentile fields.
Table: Required fields per type of data
| Field | Type of data | Description |
|---|---|---|
| Percentile | Latency | A latency percentile. Must be greater than 0 and less than or equal to 99.99 |
| Stream ID | Latency, Metric | A metric stream identifier. Read more about Streams or find out how to obtain a stream ID |
| UQL | Metric | A UQL query to retrieve telemetry data |
ServiceNow Cloud Observability UQL
You can use ServiceNow Cloud Observability Unified Query Language (UQL)
to retrieve and process your metric data.
Nobl9 supports the constant, metrics, and spans query types in the UQL.
Create your query in the ServiceNow Cloud Observability UI and copy and paste the query into Nobl9. Nobl9 then passes the query to the query_timeseries ServiceNow Cloud Observability API to retrieve the time series data.
constant queries
constant fetches a gauge time series where all points have value literal-value.
To build a query of the constant type, specify the required value:
constant 100
metrics queries
You can build the UQL queries using the following ServiceNow Cloud Observability metric kinds:
-
Gauge, an instantaneous measurement, for example,
metric memory.utilized | latest | group_by [], sum,
spans count | delta | group_by [], sum. -
Delta, a measurement of the change in metrics from point to point. For the delta-kind queries, you must choose one of the operators or appropriate reducer to convert the distribution values into scalar values to build SLI on it, for example,
metric request.size.bytes | delta | group_by [], sum | point dist_count(value)
For more information, refer to the Using distributions in UQL | ServiceNow Cloud Observability documentation. -
If you select a percentile as an operator in a query for the threshold metric SLI type, we recommend using the 100th percentile for best results as Nobl9 uses percentiles to display the data in the SLI chart. The following is an example
metricquery with Delta metric kind:
metric request.size.bytes | delta | group_by [], sum | point percentile(value, 100.0) -
If you define many aggregation values, Nobl9 will fetch data for the first aggregation value defined in your query. For example, Nobl9 will fetch data for the 100th percentile in the below query:
metric request.size.bytes | delta | group_by [], sum | point percentile(value, 100.0), percentile(value, 99.9)
lightstep:
  typeOfData: metric
  uql: metric cpu.utilization | rate | group_by [], mean
spans queries
Limitations:
ServiceNow Cloud Observability UQL spans queries supported in the public API must have retained data in ServiceNow Cloud Observability streams.
For example, when spans is not retained in a stream, the following query:
spans latency | delta | filter ((service == "adservice") || (service == "frontend")) | group_by [], sum | point percentile(value, 99.9)
will return the following error when querying the API:
"rpc error: code = InvalidArgument desc = public API only supports retained spans TQL queries at this time, please create a retained span query first"
However, when spans is retained in a stream, after creating a stream for a given filter, API starts returning a metric. For example, the following UQL query will return the metric:
spans latency | delta | filter (service == "frontend") | group_by [], sum | point percentile(value, 99.9)
if service IN ("frontend") is an existing stream.
You can verify your spans query and check the stream for retained data, following the Test API Endpoints guide instructions.
For details on the retention period, refer to your span retention policy.
Metric YAML sample:
lightstep:
  typeOfData: metric
  uql: spans count | delta | group_by [], sum
SLOs explained
Latency threshold
The Latency threshold SLO configuration uses the threshold metric method under the hood with the SLI equal to the specific percentile value defined
in SLO configuration.
Learn more about performance investigation in ServiceNow Cloud Observability.
Nobl9 retrieves percentile values from ServiceNow Cloud Observability API under data.attributes[].latencies[].
These values are represented in ServiceNow Cloud Observability on the following chart (the Latency section):
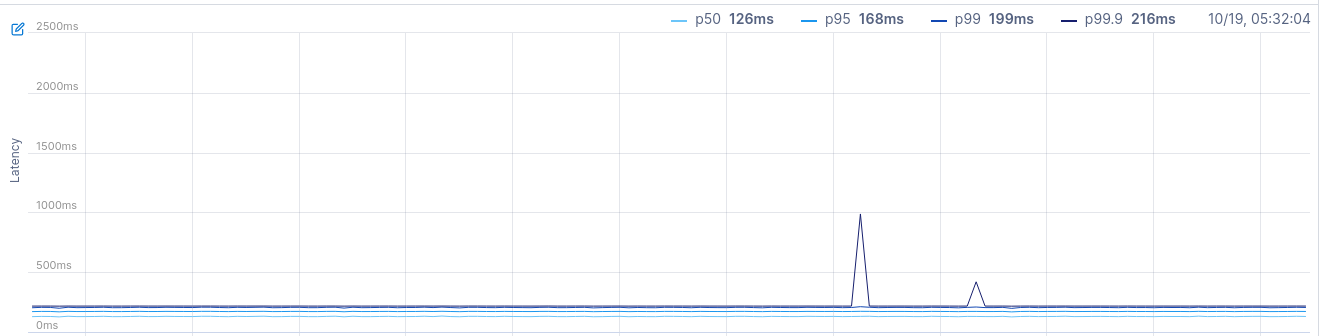
Metric YAML sample:
lightstep:
  streamID: DzpxcSRh
  typeOfData: latency
  percentile: 95
Error threshold
The Error threshold SLO configuration uses the threshold metric method under the hood with the SLI equal to the percentage of errors for a given stream.
Nobl9 retrieves te ops-counts and error-counts values from ServiceNow Cloud Observability API and uses them to calculate the value:
value = error-counts / ops-counts
Such calculated values are used as an SLI for SLOs configured with this method.
They are represented in ServiceNow Cloud Observability on the following chart (the Err% section):
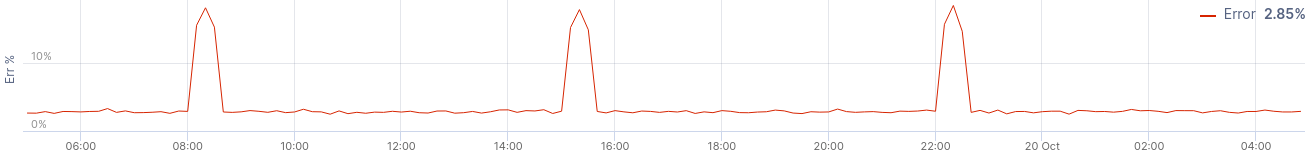
Metric YAML sample:
lightstep:
  streamID: DzpxcSRh
  typeOfData: error_rate
Error ratio
This SLO configuration uses count (ratio) metric method under the hood. Each count metric SLO needs two data streams: good and total.
With this configuration, Nobl9 retrieves the error-counts and ops-counts values from ServiceNow Cloud Observability API and calculates those data streams as following:
Good = ops-counts - error-counts
Total = ops-counts
By default, ServiceNow Cloud Observability does not show these values on chart. It shows operations per second instead.

Nobl9 doesn’t use Rate to calculate error budgets for any SLO. Events counts are used instead (calculated from ops-counts and error-counts that are retrieved from the API).
Metric YAML sample:
countMetrics:
  incremental: false
  good:
    lightstep:
      streamID: DzpxcSRh
      typeOfData: good
  total:
    lightstep:
      streamID: DzpxcSRh
      typeOfData: total
Querying the ServiceNow Cloud Observability API
The Nobl9 agent makes calls the ServiceNow Cloud Observability API once every 60 seconds.
API rate limits
ServiceNow Cloud Observability has low rate limits for its Streams Timeseries API. For Community, Professional, and Enterprise licenses it’s 60, 200, 600 requests per hour respectively. The Nobl9 agent makes requests once every 60s, which allows for one ServiceNow Cloud Observability organization to use only 1, 3, or 10 unique metric specifications. For more information, refer to the Rate Limits | ServiceNow Cloud Observability documentation.
ServiceNow Cloud Observability users can request an increase of rate limits via ServiceNow Cloud Observability customer support.
Useful links

 Monitor Metric DataServiceNow Cloud Observability docsInvestigate a Latency RegressionServiceNow Cloud Observability docsInvestigate an Error Rate IncreaseServiceNow Cloud Observability docsInvestigate a Metric DeviationServiceNow Cloud Observability docsStreams TimeseriesServiceNow Cloud Observability docsQuery TimeseriesServiceNow Cloud Observability docsRate LimitsServiceNow Cloud Observability docsUnified Query Language (UQL)ServiceNow Cloud Observability docsMetric KindsServiceNow Cloud Observability docsUsing distributions in UQLServiceNow Cloud Observability docsCreating SLOs via TerraformThe Nobl9 Terraform provider docs