Datadog
Datadog is a cloud-scale application observability solution that monitors servers, databases, tools, and services. Nobl9 connects with Datadog to collect SLI measurements and compare them to SLO targets. Nobl9 can activate processes and notifications when the error budget burn rate is too high or has been surpassed because it calculates error budgets of acceptable thresholds.
Users can pass business context through monitoring data, developing and measuring reliability targets, and aligning activities against the error budget's priorities using Nobl9 integration with Datadog.
Datadog parameters and supported features in Nobl9
- General support:
- Release channel: Stable,
Beta
- Connection method: Agent, Direct
- Replay and SLI Analyzer: Historical data limit 30 days
- Event logs: Supported
- Query checker: Supported
- Query parameters retrieval: Supported
- Timestamp cache persistence: Supported
- Connection method: Agent, Direct
- Query parameters:
- Query interval: 2 min
- Query delay: 1 min
- Jitter: 15 sec
- Timeout: 30 sec
- Query delay: 1 min
- Agent details and minimum required versions for supported features:
- Plugin name: n9datadog
- Query delay environment variable: DATADOG_QUERY_DELAY
- Replay and SLI Analyzer: 0.65.0
- Query parameters retrieval: 0.73.2
- Timestamp cache persistence: 0.65.0
- Query delay environment variable: DATADOG_QUERY_DELAY
Creating SLOs with Datadog
Nobl9 Web
Follow the instructions below to create your SLOs with Datadog in the Nobl9 Web application.
- Navigate to Service Level Objectives.
- Click
 .
. - Select a Service.
It will be the location for your SLO in Nobl9. - Select your Datadog data source.
- Modify Period for Historical Data Retrieval, if necessary.
- Defines the furthest point in the past from which data can be retrieved when replaying your Datadog SLO.
- A longer period can extend the data loading time for your SLO.
- Must be a positive whole number up to the maximum period value you've set when adding the Datadog data source.
Non-editable Replay periodNon-editable Replay period indicates that the maximum period for historical data retrieval set for your Datadog data source is set to zero.
Adjust the data source settings to create the SLO with Replay. - Metric refers to the way of calculating and interpreting data from your data source.
- Threshold metric is defined by a single numerical value (the threshold) that separates satisfactory performance from unsatisfactory performance. It's represented by a single time series evaluated against the threshold.
- Ratio metric expresses the performance as a fraction or proportion, typically by dividing the number of successful events by the total number of potential events (successes + failures). It's represented by two-time series for comparison for good events and total events.
For ratio metrics, select the Data count method.SLI values for good and totalWhen choosing the query for the ratio SLI (countMetrics), keep in mind that the values resulting from that query for both good and total:- Must be positive.
- While we recommend using integers, fractions are also acceptable.
- If using fractions, we recommend them to be larger than
1e-4=0.0001. - Shouldn't be larger than
1e+20.
-
Specify Query using the Datadog syntax.
Click to open query samples
Threshold metricavg:trace.http.request.duration{service:my-service}.as_count()Ratio metric, numeratoravg:trace.http.request.hits.by_http_status{service:my-service,!http.status_class:5xx}.as_count()Ratio metric, denominatoravg:trace.http.request.hits.by_http_status{service:my-service}.as_count()
- Define the Time window for your SLO:
- Rolling time windows constantly move forward as time passes. This type can help track the most recent events.
- Calendar-aligned time windows are usable for SLOs intended to map to business metrics measured on a calendar-aligned basis.
- Configure the Error budget calculation method and Objectives:
- Occurrences method counts good attempts against the count of total attempts.
- Time Slices method measures how many good minutes were achieved (when a system operates within defined boundaries) during a time window.
- You can define up to 12 objectives for an SLO.
Similar threshold values for objectivesTo use similar threshold values for different objectives in your SLO, we recommend differentiating them by setting varying decimal points for each objective.
For example, if you want to use threshold value1for two objectives, set it to1.0000001for the first objective and to1.0000002for the second one. - Add the Display name, Name, and other settings for your SLO:
- Name identifies your SLO in Nobl9. After you save the SLO, its name becomes read-only.
Use only lowercase letters, numbers, and dashes. - Select No data anomaly alert to receive notifications when your SLO stops reporting data for a specified period:
- Choose up to five supported Alert methods.
- Specify the delay period before Nobl9 sends an alert about the missing data.
From 5 minutes to 31 days. Default: 15 minutes
- Add alert policies, labels, and links, if required.
Limits per SLO: 20 alert policies or links, 30 labels.
- Name identifies your SLO in Nobl9. After you save the SLO, its name becomes read-only.
- Click CREATE SLO
YAML
- Threshold (rawMetric)
- Ratio (countMetric)
apiVersion: n9/v1alpha
kind: SLO
metadata:
  name: api-server-slo
  displayName: API Server SLO
  project: default
  labels:
    area:
      - latency
      - slow-check
    env:
      - prod
      - dev
    region:
      - us
      - eu
    team:
      - green
      - sales
  annotations:
    area: latency
    env: prod
    region: us
    team: sales
spec:
  description: Example Datadog SLO
  indicator:
    metricSource:
      name: datadog
      project: default
      kind: Agent
  budgetingMethod: Occurrences
  objectives:
    - displayName: Good response (200)
      value: 200
      name: ok
      target: 0.95
      rawMetric:
        query:
          datadog:
            query: avg:trace.http.request.duration{*}
      op: lte
      primary: true
  service: api-server
  timeWindows:
    - unit: Month
      count: 1
      isRolling: false
      calendar:
        startTime: '2022-12-01 00:00:00'
        timeZone: UTC
  alertPolicies:
    - fast-burn-5x-for-last-10m
  attachments:
    - url: https://docs.nobl9.com
      displayName: Nobl9 Documentation
  anomalyConfig:
    noData:
      alertMethods:
        - name: slack-notification
          project: default
      alertAfter: 1h
apiVersion: n9/v1alpha
kind: SLO
metadata:
  name: api-server-slo
  displayName: API Server SLO
  project: default
  labels:
    area:
      - latency
      - slow-check
    env:
      - prod
      - dev
    region:
      - us
      - eu
    team:
      - green
      - sales
  annotations:
    area: latency
    env: prod
    region: us
    team: sales
spec:
  description: Example Datadog SLO
  indicator:
    metricSource:
      name: datadog
      project: default
      kind: Agent
  budgetingMethod: Occurrences
  objectives:
    - displayName: Good response (200)
      value: 1
      name: ok
      target: 0.95
      countMetrics:
        incremental: true
        good:
          datadog:
            query: >-
              sum:trace.http.request.hits.by_http_status{http.status_class:2xx}.as_count()
        total:
          datadog:
            query: sum:trace.http.request.hits.by_http_status{*}.as_count()
      primary: true
  service: api-server
  timeWindows:
    - unit: Month
      count: 1
      isRolling: false
      calendar:
        startTime: '2022-12-01 00:00:00'
        timeZone: UTC
  alertPolicies:
    - fast-burn-5x-for-last-10m
  attachments:
    - url: https://docs.nobl9.com
      displayName: Nobl9 Documentation
  anomalyConfig:
    noData:
      alertMethods:
        - name: slack-notification
          project: default
      alertAfter: 1h
Click to open field reference
| Field | Type | Description |
|---|---|---|
apiVersion Mandatory | string | API version. Use n9/v1alpha |
kind Mandatory | string | The resource type. Use SLO |
| Metadata | ||
metadata.name Mandatory | string | Name identifier for the SLO. Use only lowercase alphanumeric characters |
metadata.displayName | string | User-friendly SLO name |
metadata.project Mandatory | string | The name identifier of the project where you need to host your SLO |
metadata.labels | object (map: string[]) | Grouping labels for filtering or viewing |
metadata.annotations | object (map: string) | Flat string annotations |
| Spec | ||
spec.description | string | SLO description |
spec.indicator.metricSource.name Mandatory | string | Data source name |
spec.indicator.metricSource.project Mandatory | string | Project containing the data source |
spec.indicator.metricSource.kind Mandatory | string | Data source connection method. Can be Agent or Direct |
spec.budgetingMethod Mandatory | enum | Error budget calculation method. Can be Occurrences or Time slices |
spec.objectives Mandatory | array | Your SLO objective definition, up to 12 objectives per SLO. |
spec.objectives[].displayName | string | User-friendly objective name |
spec.objectives[].value Mandatory | number | Data point values that is considered "good" (e.g., 200.0).In SLOs with two or more objectives, keep each objective's value unique. In ratio ( count) metrics, value is retained for legacy purposes. |
spec.objectives[].name Mandatory | string | Name identifier for this objective |
spec.objectives[].op Mandatory | string (enum) | Operator for objective. One of:lte (less than or equal to)lt (less than)gte (greater than or equal to)gt (greater than) |
spec.objectives[].target Mandatory | float | The percentage of the good minutes or occurrences that must meet the desired performance (e.g., is the target is 0.95, the good performance is expected to be observed in at least 95% of the time window) |
spec.objectives[].rawMetric/.countMetric Mandatory | object | The metric type indicator. Set:rawMetric for a threshold metriccountMetric for a ratio metric.A ratio metric requires the additional fields: countMetric.incremental (boolean) the data count methodcountMetric.good/.bad and countMetric.total a numerator and denominator queries |
spec.objectives[].countMetric.incremental Mandatory | boolean | The data count method for a ratio (countMetric) metric type |
spec.objectives[].primary | boolean | The indicator of a primary SLO objective |
spec.service Mandatory | string | The name identifier of a service to host this SLO. The service must exist in the project specified in metadata.project |
spec.timeWindows Mandatory | array | Defines SLO time window for error budget calculation. Set: isRolling: true for the rolling time window typeisRolling: false for the calendar-aligned type |
spec.timeWindows.unit Mandatory | integer | The time window units. One of:Day | Hour | Minute for the rolling time windowYear | Quarter | Month | Week | Day for the calendar-aligned time window |
spec.timeWindows.count Mandatory | integer | The number of units in a time window |
spec.timeWindows.startTime | string | Mandatory for calendar-aligned time windows. Date and time in the format YYYY-MM-DDTHH:mm:ss |
spec.timeWindows.timeZone | string | Mandatory for calendar-aligned time-windows. A valid IANA Time Zone Database name |
spec.timeWindows.isRolling Mandatory | boolean | true for the rolling time window typefalse for the calendar-aligned type |
spec.alertPolicies | array | The name identifiers of alert policies to be linked to this SLO (must be from the same project as the SLO). Up to 20 alert policies per SLO. |
spec.attachments | array | Links to any additional attributes of this SLO |
spec.anomalyConfig | object | Settings for a manual no data anomaly detection rule |
spec.noData.alertMethods | array | List of alert methods for no-data anomaly. Up to five alert methods per SLO. Every alert method must have the name and project fields |
spec.noData.alertAfter | string | Waiting time before sending a no-data notification. Must be 5m to 31d.Default: 15m |
spec.noData.treatZeroAsNoData | boolean | Opt-in setting for manual no-data anomaly detection. When set to true, zero-valued points are treated as no data for this alerting flow.Default: false |
| Source-specific fields | ||
datadog.queryMandatory | string | A Datadog query |
Query requirements and recommendations
- Your Datadog query must return only one time series.
Grouping metrics result in multiple time series and is not supported.
- Incorrect query:
avg:system.load.1{*} by {host}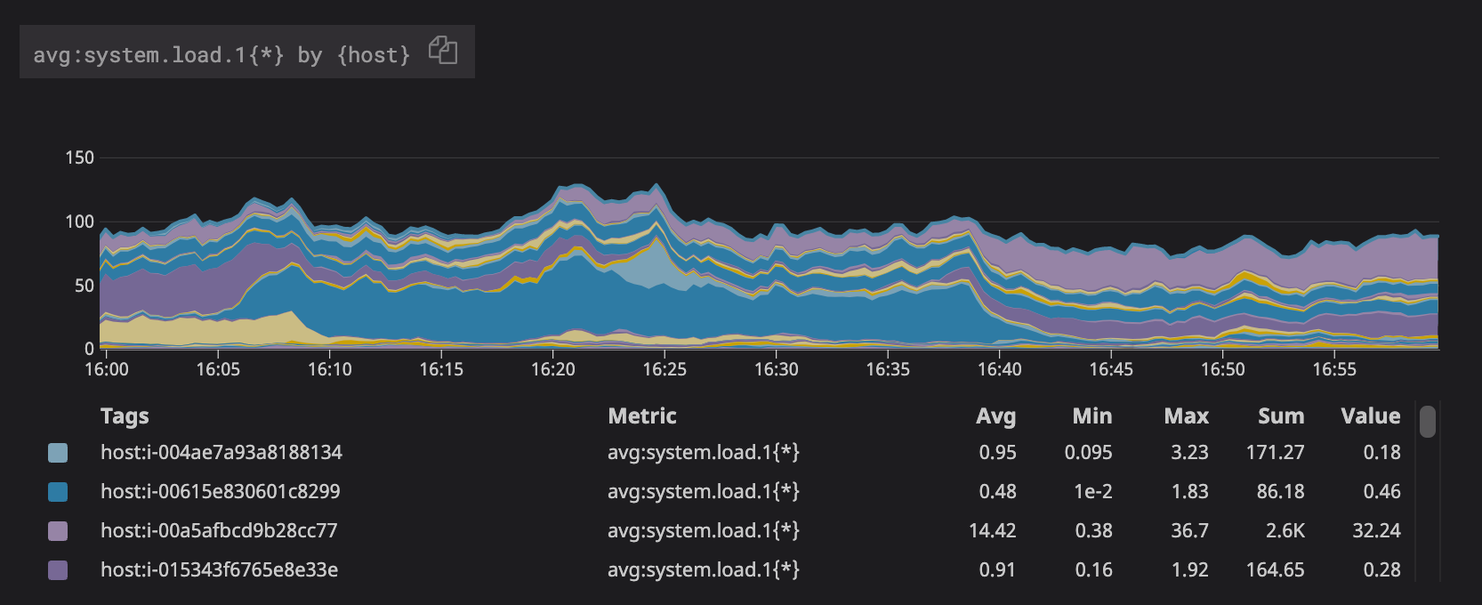
A query with metric grouping returns multiple time series - Correct query:
avg:system.load.1{*}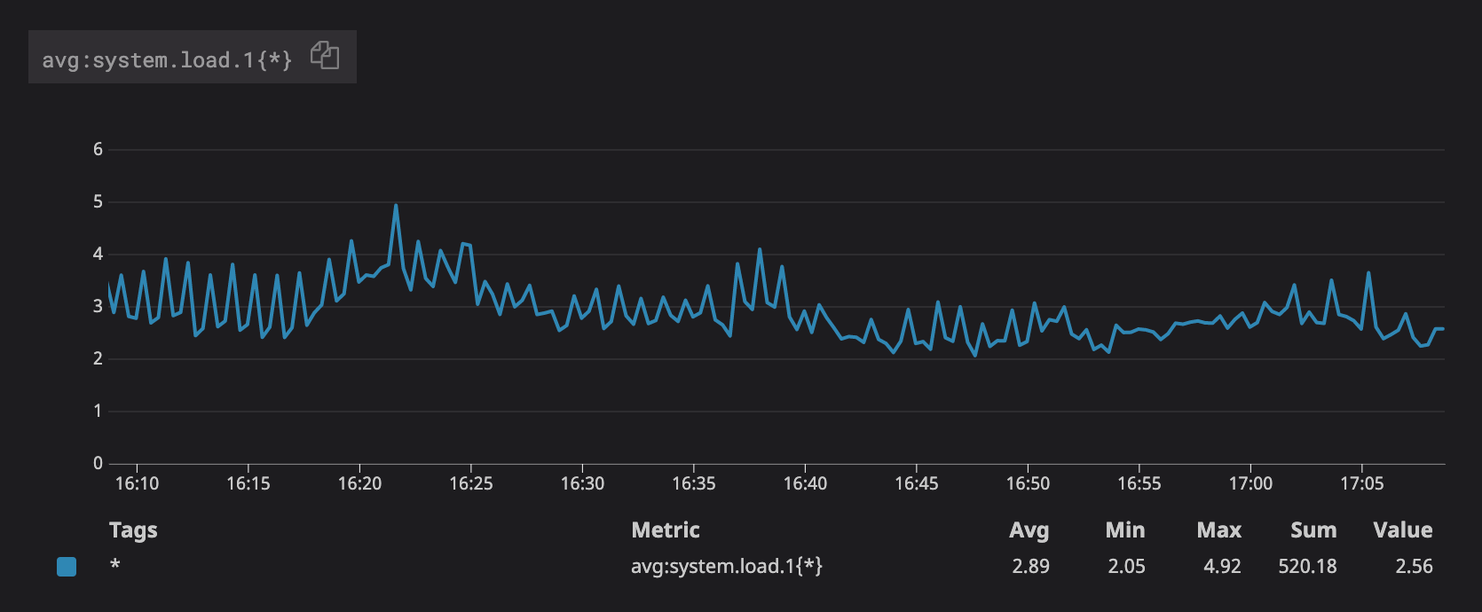
The same query without metric grouping returns a single time series
- Avoid using rollup functions in queries.
The Nobl9 agent uses enforced rollup to ensure your SLI calculations are accurate. For this reason, we recommend avoiding the .rollup() and .moving_rollup() functions in your queries.
Using these functions can interfere with the Nobl9 data collection process and skew data points, which can lead to inaccurate error budget calculations.
Querying Datadog and API rate limits
Nobl9 retrieves SLI data (an SLI represents a single time series) from Datadog's Query Timeseries API. To operate efficiently within Datadog's rate limits, Nobl9 optimizes how it sends requests.
Table: Key parameters
| Parameter | Details |
|---|---|
| Query frequency | Every two minutes |
| Datadog API default rate limit | 1600 requests per hour (per organization) |
| Retrieved SLI baseline | Minimum of 52 SLIs per two-minute interval (with no batching) |
| Nobl9's optimization strategy | Batches queries into single 1024-character requests; sends identical queries once per cycle |
The number of SLIs per interval depends on query length and batching efficiency.
If you require a higher rate limit, contact your Datadog representative.
An incorrect query can cause processing delays for all other queries in the same batch. To avoid this, we recommend verifying your queries are correct before saving the SLO.

