Data anomaly detection
Data anomaly detection is crucial for maintaining reliable SLO monitoring. When the data stream from your data source has any deviations, your SLOs cannot be calculated properly, creating blind spots in your observability.
Nobl9 offers two ways to detect data anomalies:
- Manually configured detection of no data. It is available for everyone—you set up notifications for your SLO. These notifications trigger when this SLO stops reporting data for a duration you set.
- Automatic data anomaly detection. This is an advanced feature for the Nobl9 Enterprise Edition. With it, four data anomaly types are detected automatically. The auto-detection feature is enabled for all SLOs and uses centralized defaults that can be customized on demand.
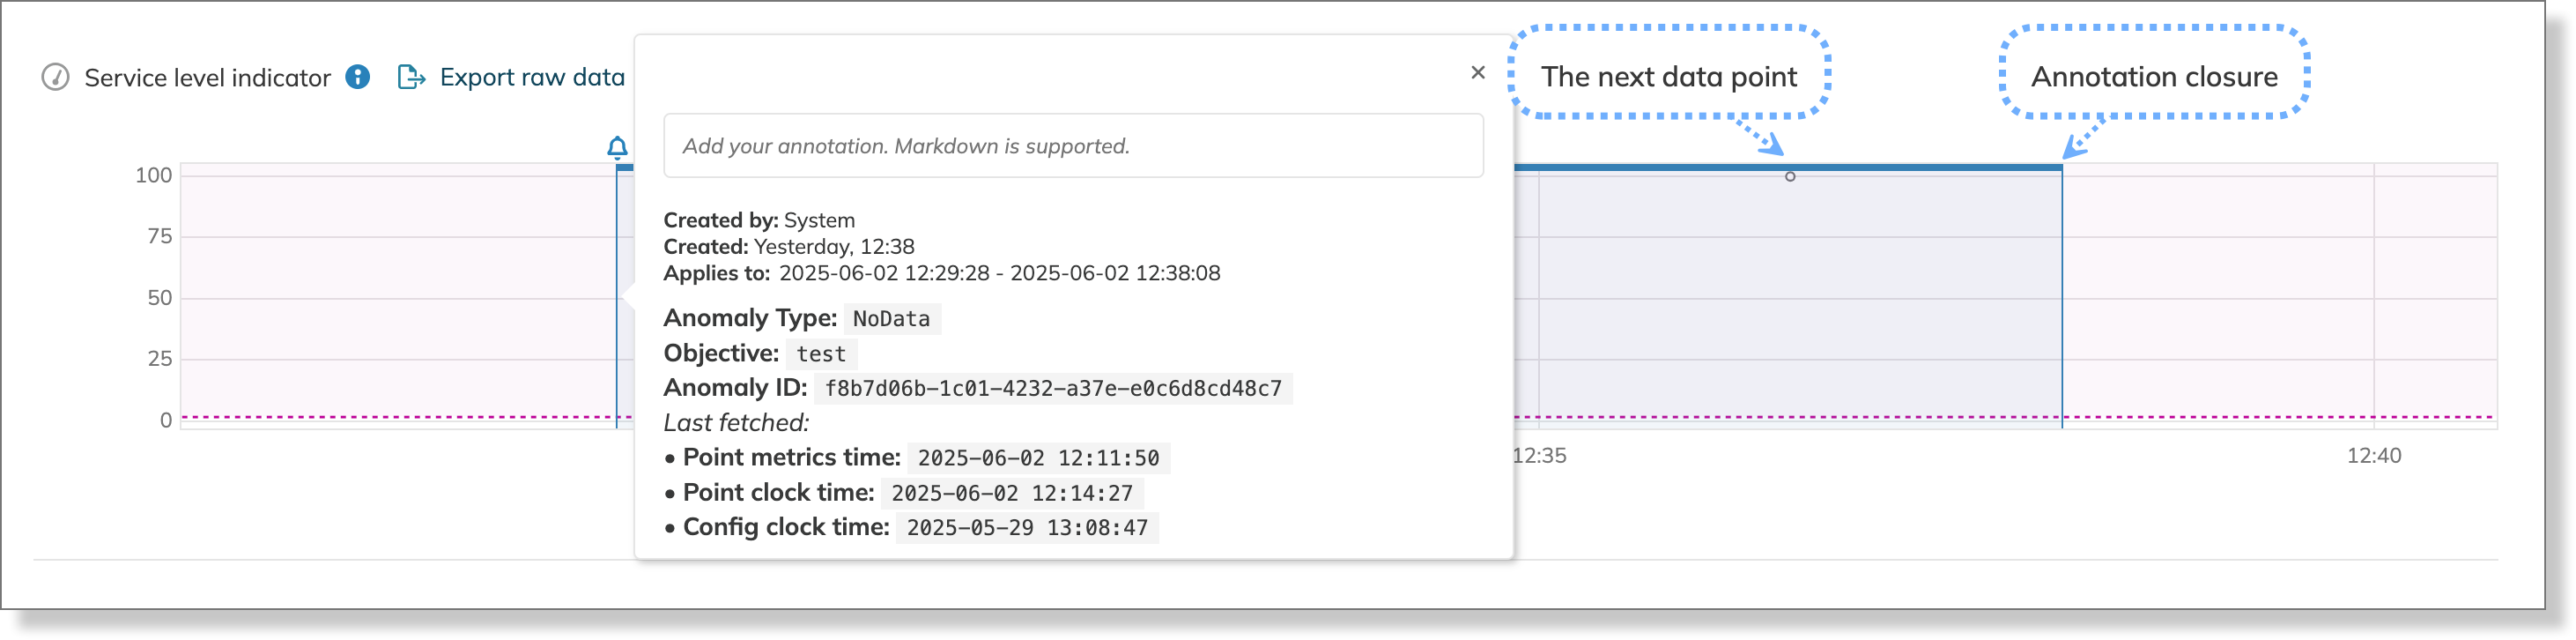
Once a data anomaly is detected, Nobl9 creates an SLO annotation with details about the anomaly and a link to the affected SLO.
Manual configuration and auto-detection both operate fully and seamlessly alongside each other.
This article describes the data anomalies in detail and suggests troubleshooting steps for each anomaly type.
No data manual configuration
With manually configured No data anomaly detection, you're setting up notifications for no data. The notifications are sent using one of the supported alert methods. Ensure you have access to at least one of the following:
You can set up data anomaly detection:
- In the SLO wizard within the Nobl9 Web application
- Applying an SLO YAML definition with
sloctl apply - Using the Nobl9 Terraform provider
- Nobl9 Web application
- sloctl
- Nobl9 Terraform provider
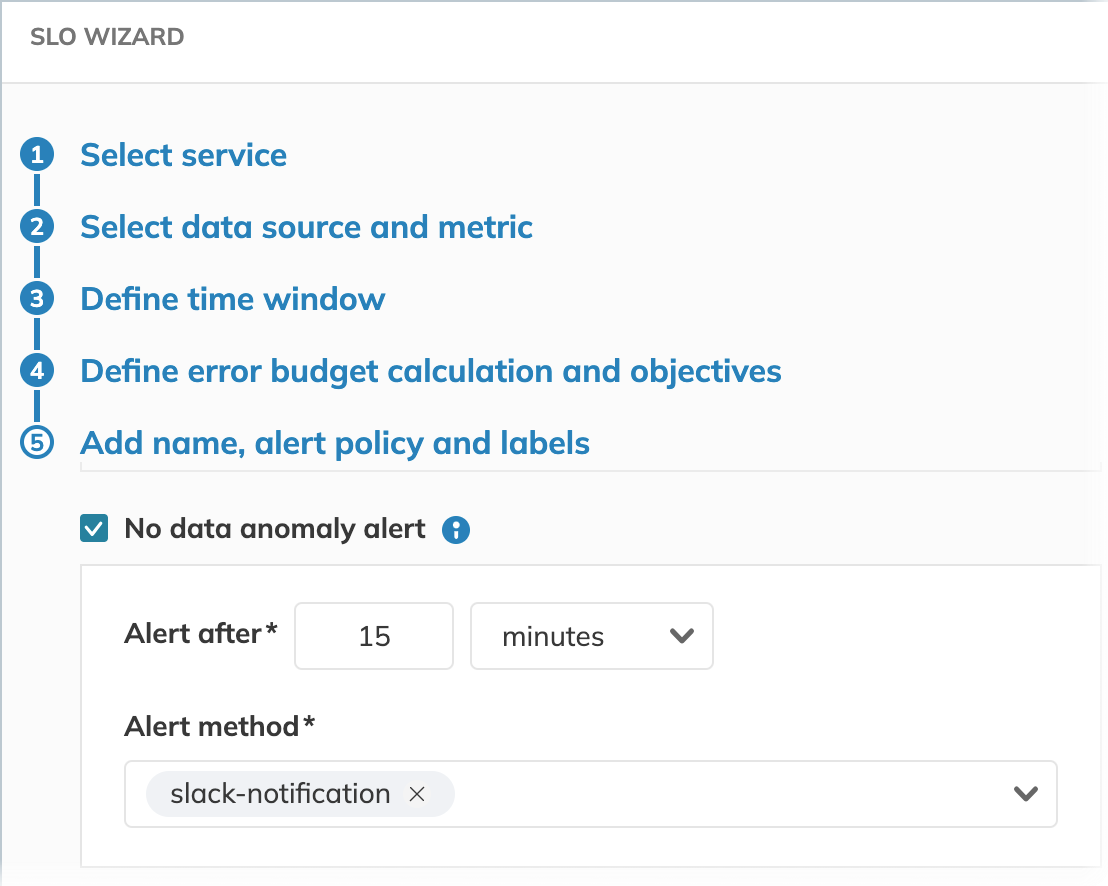
To configure data anomaly detection in the Nobl9 Web application, select No data anomaly alert in Step 5 of the SLO wizard. Then, specify how long your SLO must wait for data before sending the notification and select your preferred alert method:
To set up data anomaly detection using sloctl, configure the noData parameters in your SLO YAML definition:
- apiVersion: n9/v1alpha
  kind: SLO
  metadata:
    name: my-slo
    project: my-project
  spec:
    alertPolicies: []
    anomalyConfig:
      noData:
        alertMethods:
          - name: my-alert-method-1
            project: my-project-1
          - name: my-alert-method-1
            project: my-project-2
        alertAfter: 1h
Then, apply it with sloctl apply.
To set up data anomaly detection using Nobl9 Terraform provider, follow the below pattern:
[...]
  anomaly_config {
     no_data {
       alertAfter = "15m"

       alert_method {
         name = "my-alert-method-1"
         project = "my-project-1"
       }

       alert_method {
         name = "my-alert-method-2"
         project = "my-project-2"
       }
     }
   }
- You can add up to five alert methods for your manual no data anomaly notifications per SLO
- To receive notifications for no data anomalies, you must have access to both the SLO and the alert method it uses
- Query parameters, like query delay, can affect when Nobl9 sends notifications for missing data and the duration of the corresponding annotations. This creates a difference in timestamps: SLO charts use the time from the data source, while notifications and annotations are based on when Nobl9's query confirms the anomaly.
| Data point | Time in a data source | Time in Nobl9 | No data anomaly detection time |
|---|---|---|---|
| Last data point before no data period | 13:00:00 | 13:05:00 | 13:15:00 |
| First data point after no data period | 14:00:00 | 14:05:00 | 14:15:00 |
Data anomaly auto-detection Enterprise
Automatic data anomaly detection is available exclusively in the Nobl9 Enterprise Edition
The following data anomaly types are detected:
| Data anomaly | Description | Default waiting time | Default cooldown |
|---|---|---|---|
| No data | No data is being reported by an SLO objective for one week | 1 week | No cooldown |
| Constant burn | An SLO objective is constantly burning its error budget for an unusually long time | 1 week | 30 minutes |
| No burn | An SLO objective is not burning its error budget for an unusually long time | 8 weeks | No cooldown |
| Incremental mismatch | A ratio SLO, configured with the incremental data count method, has received a non-incremental data point | Triggered immediately | 1 day |
Contact Nobl9 Support to set a custom waiting time or cooldown interval for your organization.
No data
This data anomaly type employs a longer-term monitoring mechanism than a manually configured one. It identifies SLOs that have ceased reporting data for an extended period, with a default of one week, to catch silent, persistent failures such as misconfigured queries that return no data or data source downtimes.
Troubleshooting steps
| Most common causes | Fixes |
|---|---|
| Data source connection issues | Check the connection status |
| Incorrect query syntax or configuration | Review the query |
| Network connectivity issues | Check a status page of your data source |
| Data source configuration issues | Examine query parameters (query interval and timeout settings) |
| Errors in data source specific field | Verify if source-specific settings are relevant. Pay attention to authentication details and URLs |
Constant and no burn
An SLO's error budget should burn and recover in a way that reflects the actual performance patterns of your service. A burn rate that is either consistently high or completely flat often signals a problem. This deviation can indicate a misconfigured SLO. It can also suggest problems with the SLO's interpretation of the underlying data that feed the SLI calculations, so it may not provide a faithful representation of your system's reliability.
Nobl9 automatically detects these patterns and creates a data anomaly annotation with the details of such an issue.
- Constant burn is detected when an SLO continuously consumes its error budget without any periods of recovery. This can be a sign that the SLO is not providing a complete picture using the data it receives.
- No burn is detected when an SLO shows perfect or near-perfect reliability over an extended period. While this may seem ideal, it often means the SLO is not sensitive enough to be a meaningful indicator of service quality.
Both scenarios render an SLO ineffective as a reliability measurement tool. A properly configured SLO should burn error budget during actual service degradation and recover during normal operations, providing meaningful insights into your system's health and user experience.
Nobl9's default settings for the constant and no burn are specified in the table below. For the Constant burn data anomaly, Nobl9 also applies a cooldown. During the cooldown, it ignores the signs of constant burn for the same objective and waits for the burn rate to stabilize. If the burn rate doesn't stabilize within the cooldown period, Nobl9 starts the countdown for another constant burn data anomaly.
| Data anomaly | Default waiting time | Cooldown |
|---|---|---|
| Constant burn | 1 week | 30 minutes |
| No burn | 8 weeks | No cooldown |
While we do our best to help you identify misconfigurations, the range of potential causes is too extensive to guarantee that all data anomalies are solely due to misconfigurations.
That is why a Constant burn data anomaly may be triggered by an actual incident on your system side, instead of a misconfiguration.
Similarly, for No burn, most cases should point to misconfigurations; however, some data anomalies may be produced for a normal, healthy SLO that simply has not burned its error budget.
Treat data anomalies as hints rather than definitive signals that demand an immediate response.
Troubleshooting steps
Most common causes:
- Threshold SLOs
- The target of at least one SLO objective is too strict, causing a constant error budget burn
- SLO objective's target is too lenient, which prevents the error budget from burning even when the system is not performing well
- Ratio SLOs
- The numerator is too narrow, and the denominator is too broad, leading to a constant error budget burn
- The numerator and denominator count almost the same set of events, resulting in the reliability of nearly 100% and no error budget burn
Fixes:
- Use SLI Analyzer to test different target settings
- Adjust targets based on historical performance data
Incremental mismatch
This data anomaly can be detected in ratio SLOs only with the data count method set to Incremental.
For every ratio SLO, the data count method must be specified. It depends on the incoming data stream and can be incremental or non-incremental.
- Non-incremental metric values can increase and decrease arbitrarily over the time window.
Non-incremental SLI charts appear as a sawtooth or step function
Example: you're monitoring a CPU load, which can increase and decrease arbitrarily - Incremental metrics are cumulative. They are characterized by constantly increasing values. Incremental SLI charts are represented by an increasing line that typically drops at the beginning of a new time window
Example: you're monitoring the total number of requests in a web application
When your incremental ratio SLO receives a non-incremental data point (i.e., a value lower than the previous one), Nobl9 identifies this as an incremental mismatch data anomaly. It then creates an annotation on the SLI chart of the affected objective. To prevent clutter from excessive annotations, a cooldown period is initiated, which lasts for one day. Each objective in your SLOs can only have one incremental mismatch data anomaly per day.
Troubleshooting steps
The cause:
- The data count method is set incorrectly
Fixes:
- Create another SLO, specifying the proper data count method
This setting isn't available for editing, so a new SLO is the only available option - Carefully explore the incoming data stream to determine the correct data count method
- Use SLI Analyzer to try different data count methods
Data anomalies vs. alerts
While both data anomalies and alerts can create annotations on an SLO objective, they are distinct concepts with different purposes and configurations. The following table summarizes their key differences.
| Parameter | Data anomaly | Alert |
|---|---|---|
| Definition | An automatically detected deviation from expected data patterns, common to all SLOs | A user-defined notification triggered when specific, configured conditions are met |
| Focus | The integrity of incoming data | SLO's error budget or error budget burn rate |
| Trigger | Built-in system logic that analyses data patterns | A specific, user-configured alert policy |
| Rules | System-defined and cannot be changed by the user | Customizable by the user |
| Notifications | Doesn't send notifications using alert methods Except for manual No data anomalies | Sends notifications using configured alert methods |
| Silencing | Cannot be silenced | Can be silenced based on user configuration |
Manually configured No data detection rule follows the same logic as the auto-detection rule but must be enabled for an SLO explicitly and allow you to customize the waiting time and choose a specific alert method for notifications.

