Analyzing SLIs
To create an analysis, complete two steps:
- Select an SLI to import data.
- Configure settings for analysis.
Import SLI data
For analysis, SLI Analyzer imports data first. Specify the SLI you need to analyze. For this, do the following:
-
Go to the SLI Analyzer section on the Nobl9 Web.
-
Click
.
The SLI analysis page opens.

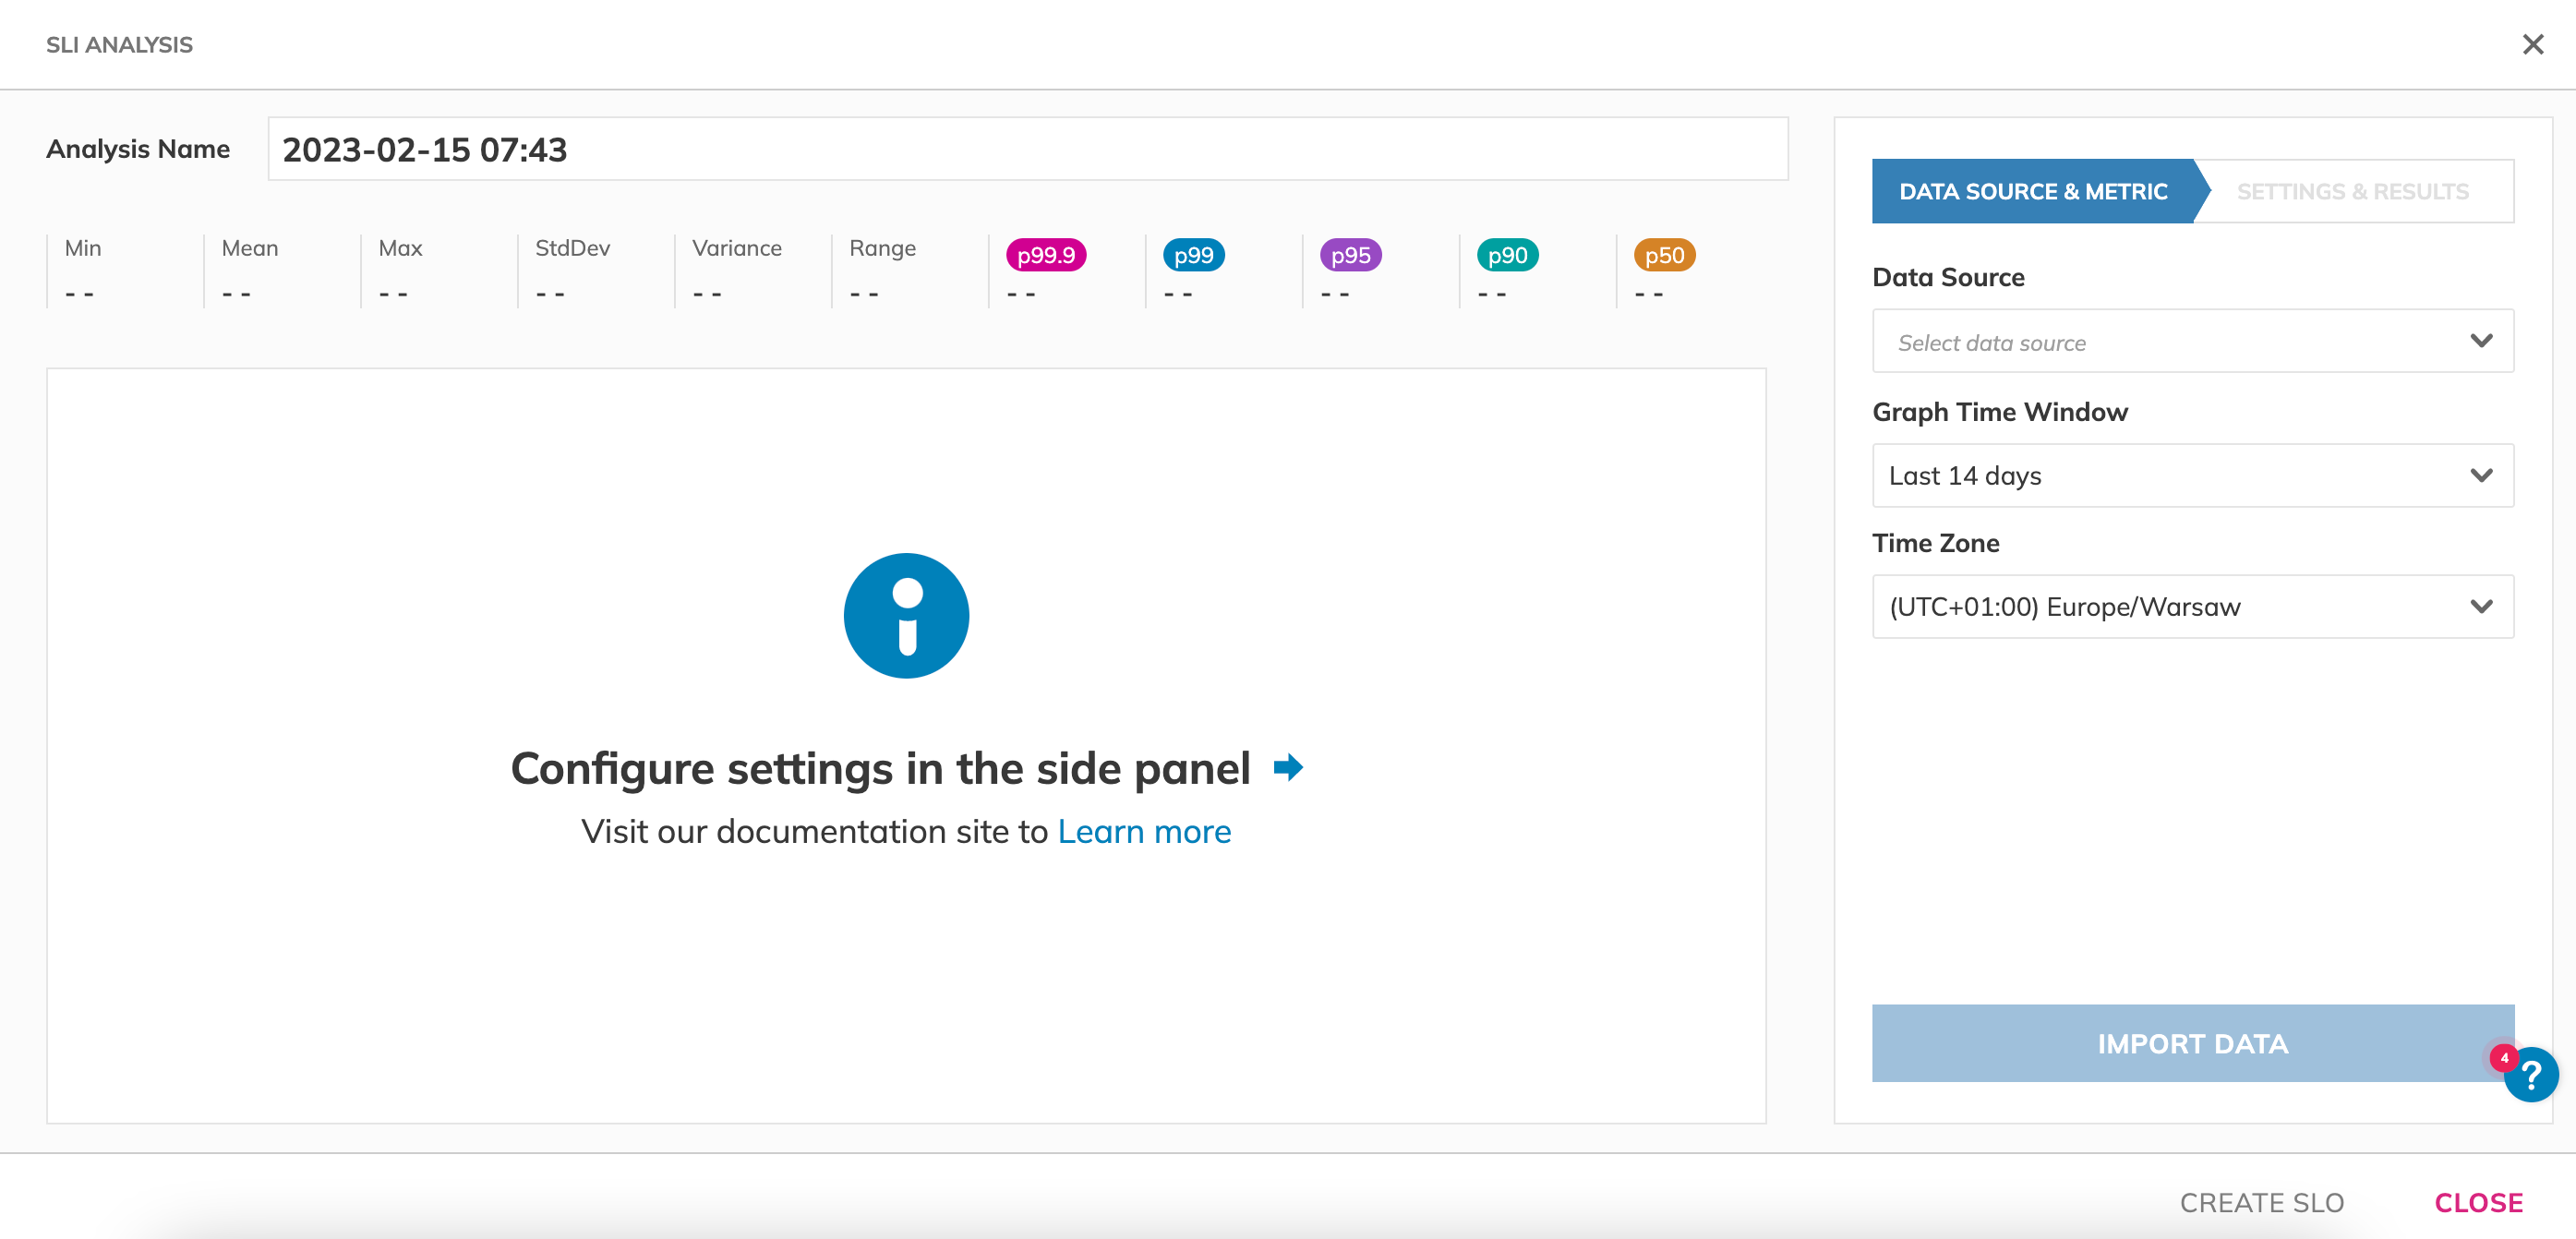
Create SLI analysis - Step 1 -
Enter analysis Name.
It's a display name—spaces, uppercase letters, and special symbols are allowed. -
Select a data source available in your organization.
-
Specify the Metric and provide a query.
Refer to your data source documentation for metric and query details.Data point densityMake sure the points in your query are not too sparse—SLI Analyzer requires at least one point per minute.
Learn more about data point density. -
Specify the Graph Time Window.
- SLI Analyzer fetches historical data from your data source for the period starting from your current time to the past date, according to the period you specify. Based on the data obtained, SLI Analyzer calculates the error budget.
- By default, the graph time window set to the data source's maximum historical data retrieval period.
- SLI Analyzer doesn't support rolling time windows.
- For a proper SLI Analyzer operation, set the time window to at least five minutes.
Graph time windowLonger graph time windows take more time to import and analyze SLI data as there is more data to downsample. Shorter graph time windows take less time for the charts to appear, but may omit important data.
-
Set the Time Zone.
-
Click Import Data.
| Status name | Status description | Notes |
|---|---|---|
Importing... | SLI Analyzer is importing data | You can close the SLI analysis page with the ongoing import—the process continues in the background |
Import complete | Data is imported successfully, ready for analysis | Once the import is complete, you can proceed with analysis settings. Find the required entry by the analysis and data source names |
Import failed | Data isn't imported properly | Refer to Troubleshooting to find out why this can happen |
Depending on the data source’s API and graph time window, data import can take 2–45 minutes. If the process takes longer, contact support@nobl9.com.
Your analysis page displays raw statistical data calculated for the SLI along with the Service Level Indicator and SLI values distribution charts visualizing the obtained data. Learn more about import results.
You cannot adjust data source and metrics settings (data source, metric, query) after the data import has started. To change those settings, create a new analysis.
Create analysis
After the successful data import, you can analyze the obtained data. For this, do the following:
-
Open the already created analysis that is in the Import complete status.
-
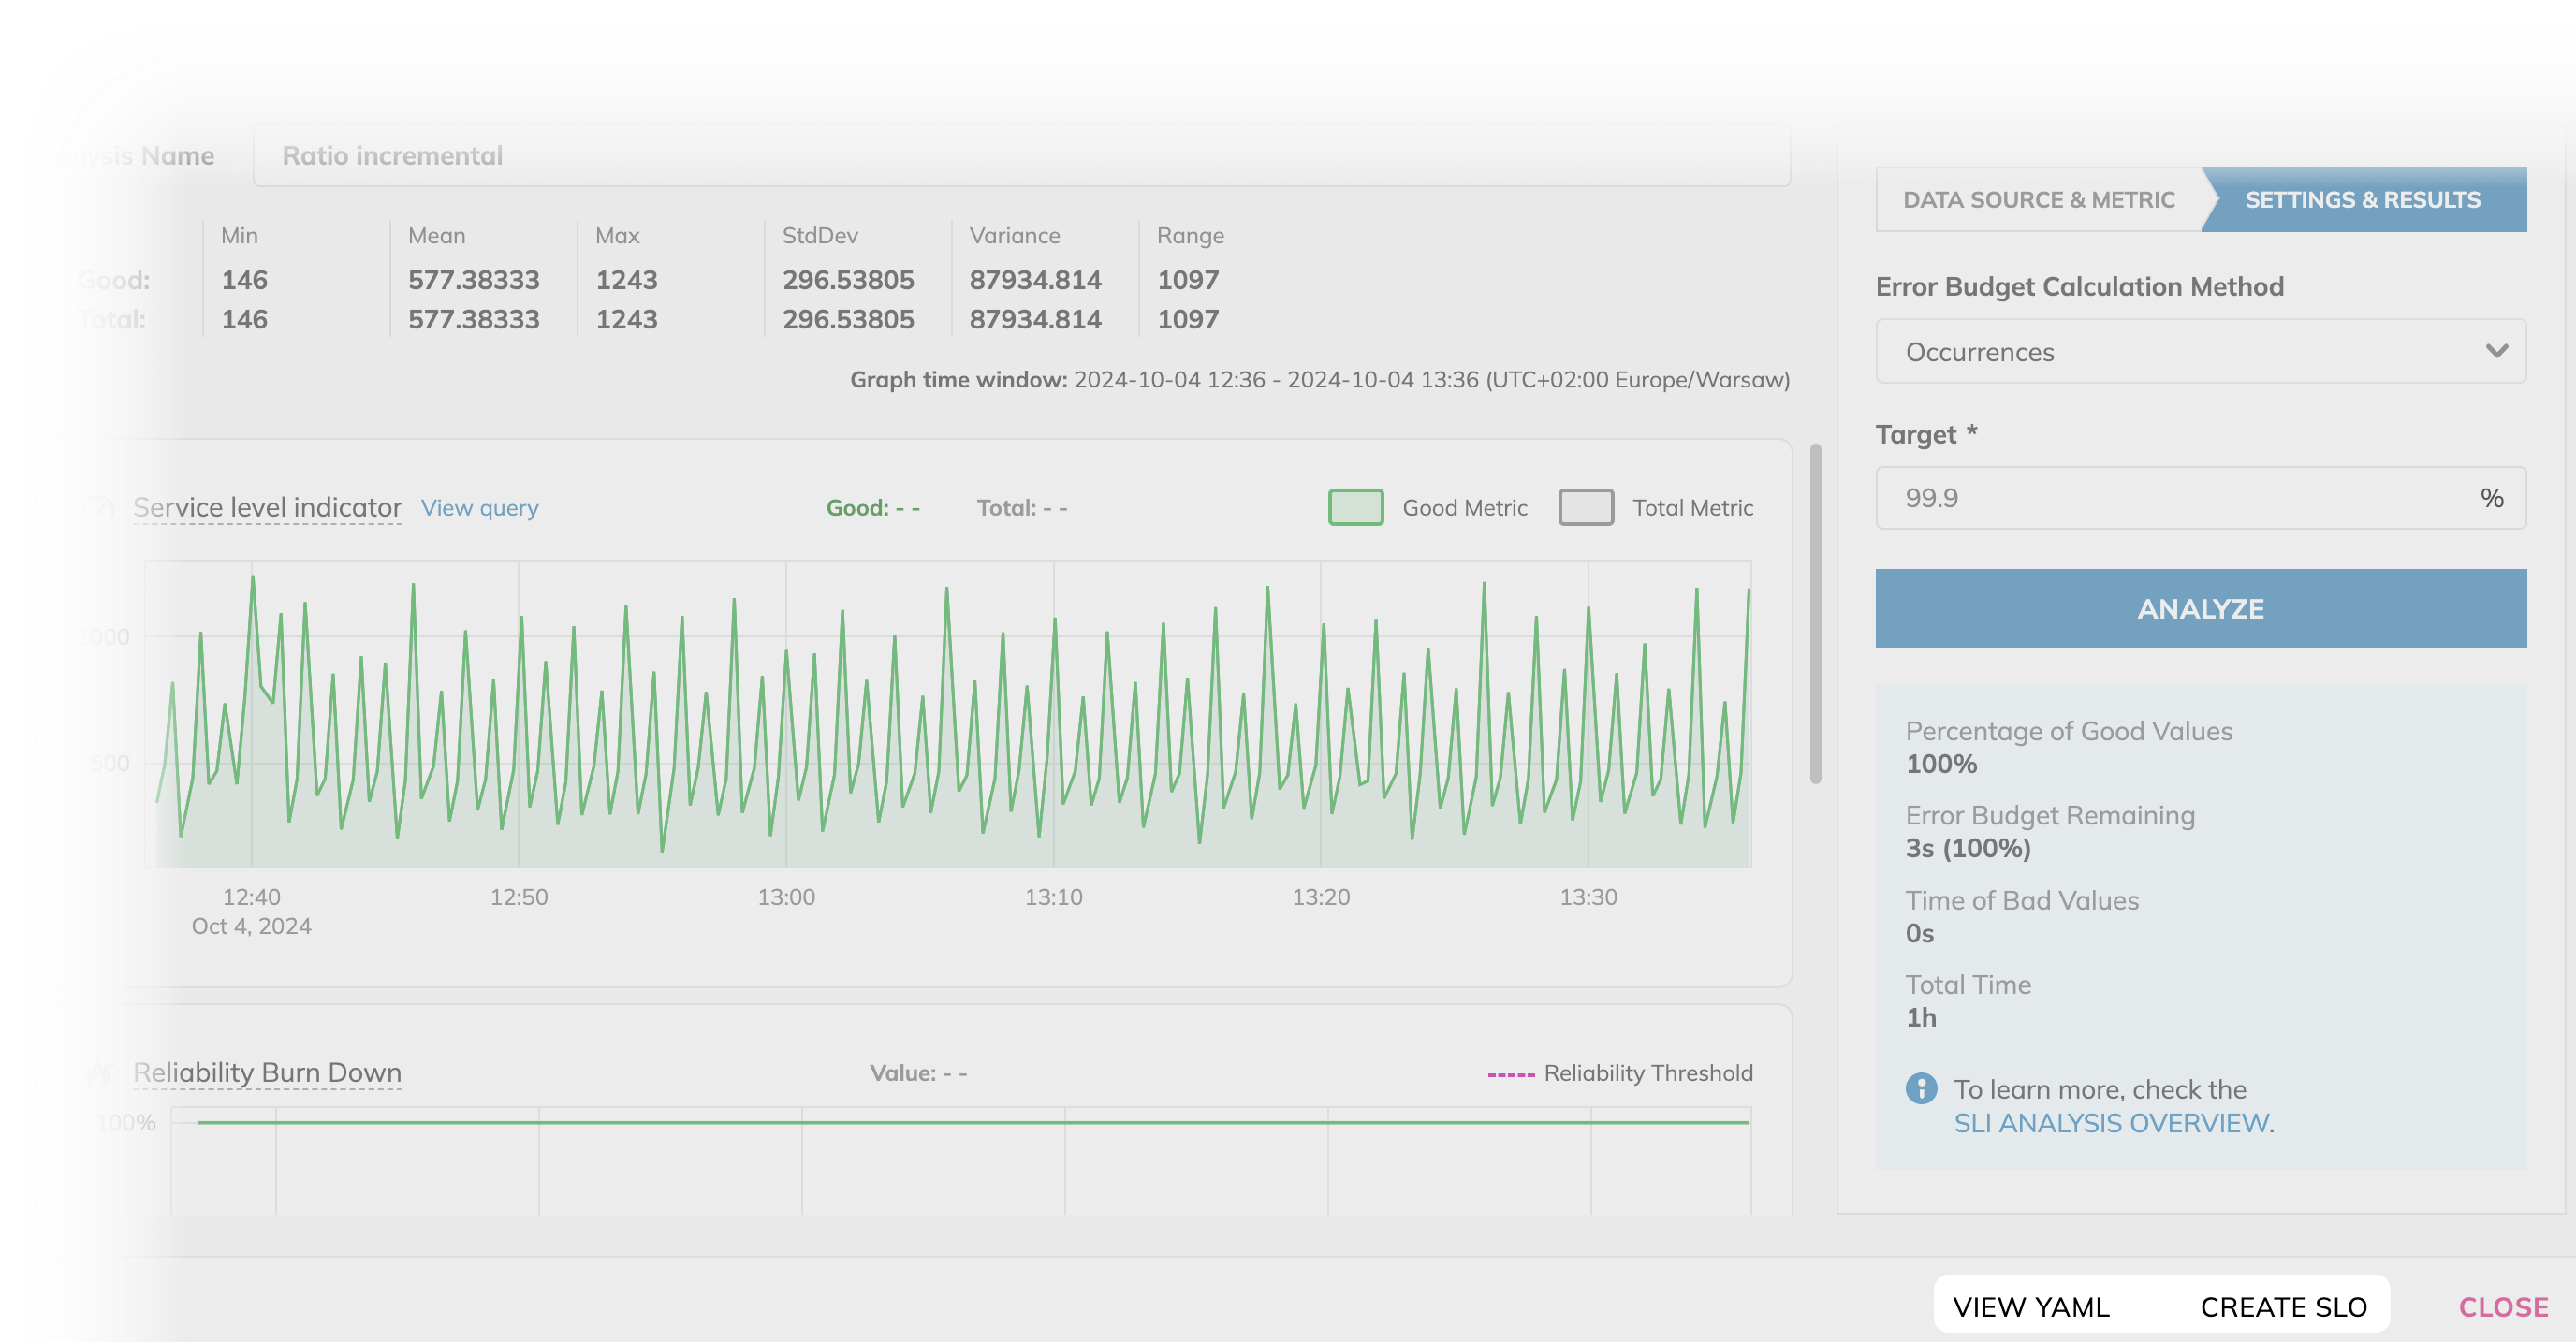
Select the Error Budget Calculation Method.
Nobl9 supports two budgeting methods: occurrences and time slices.- Occurrences: enter the Target and Values to define the reliability target for SLO.
- Time slices: enter the Time Slice Allowance and Target to define the reliability target for time slice and SLO.
Threshold metricIf you selected a threshold metric when importing data, you can set target Values to compare the values gathered from the metric source. For example, if
Values less than 200is the objective for aGoodexperience, values below 200 are considered good. -
Click Analyze to see how your error budget performs with the selected values.
Table: Analysis statuses
| Status | Description |
|---|---|
Analyzing... | SLI analysis is in progress. |
Analysis complete | SLI analysis completed successfully. |
Analysis failed | SLI analysis isn't completed. Refer to Troubleshooting to find out why this can happen. |
Job Status widget
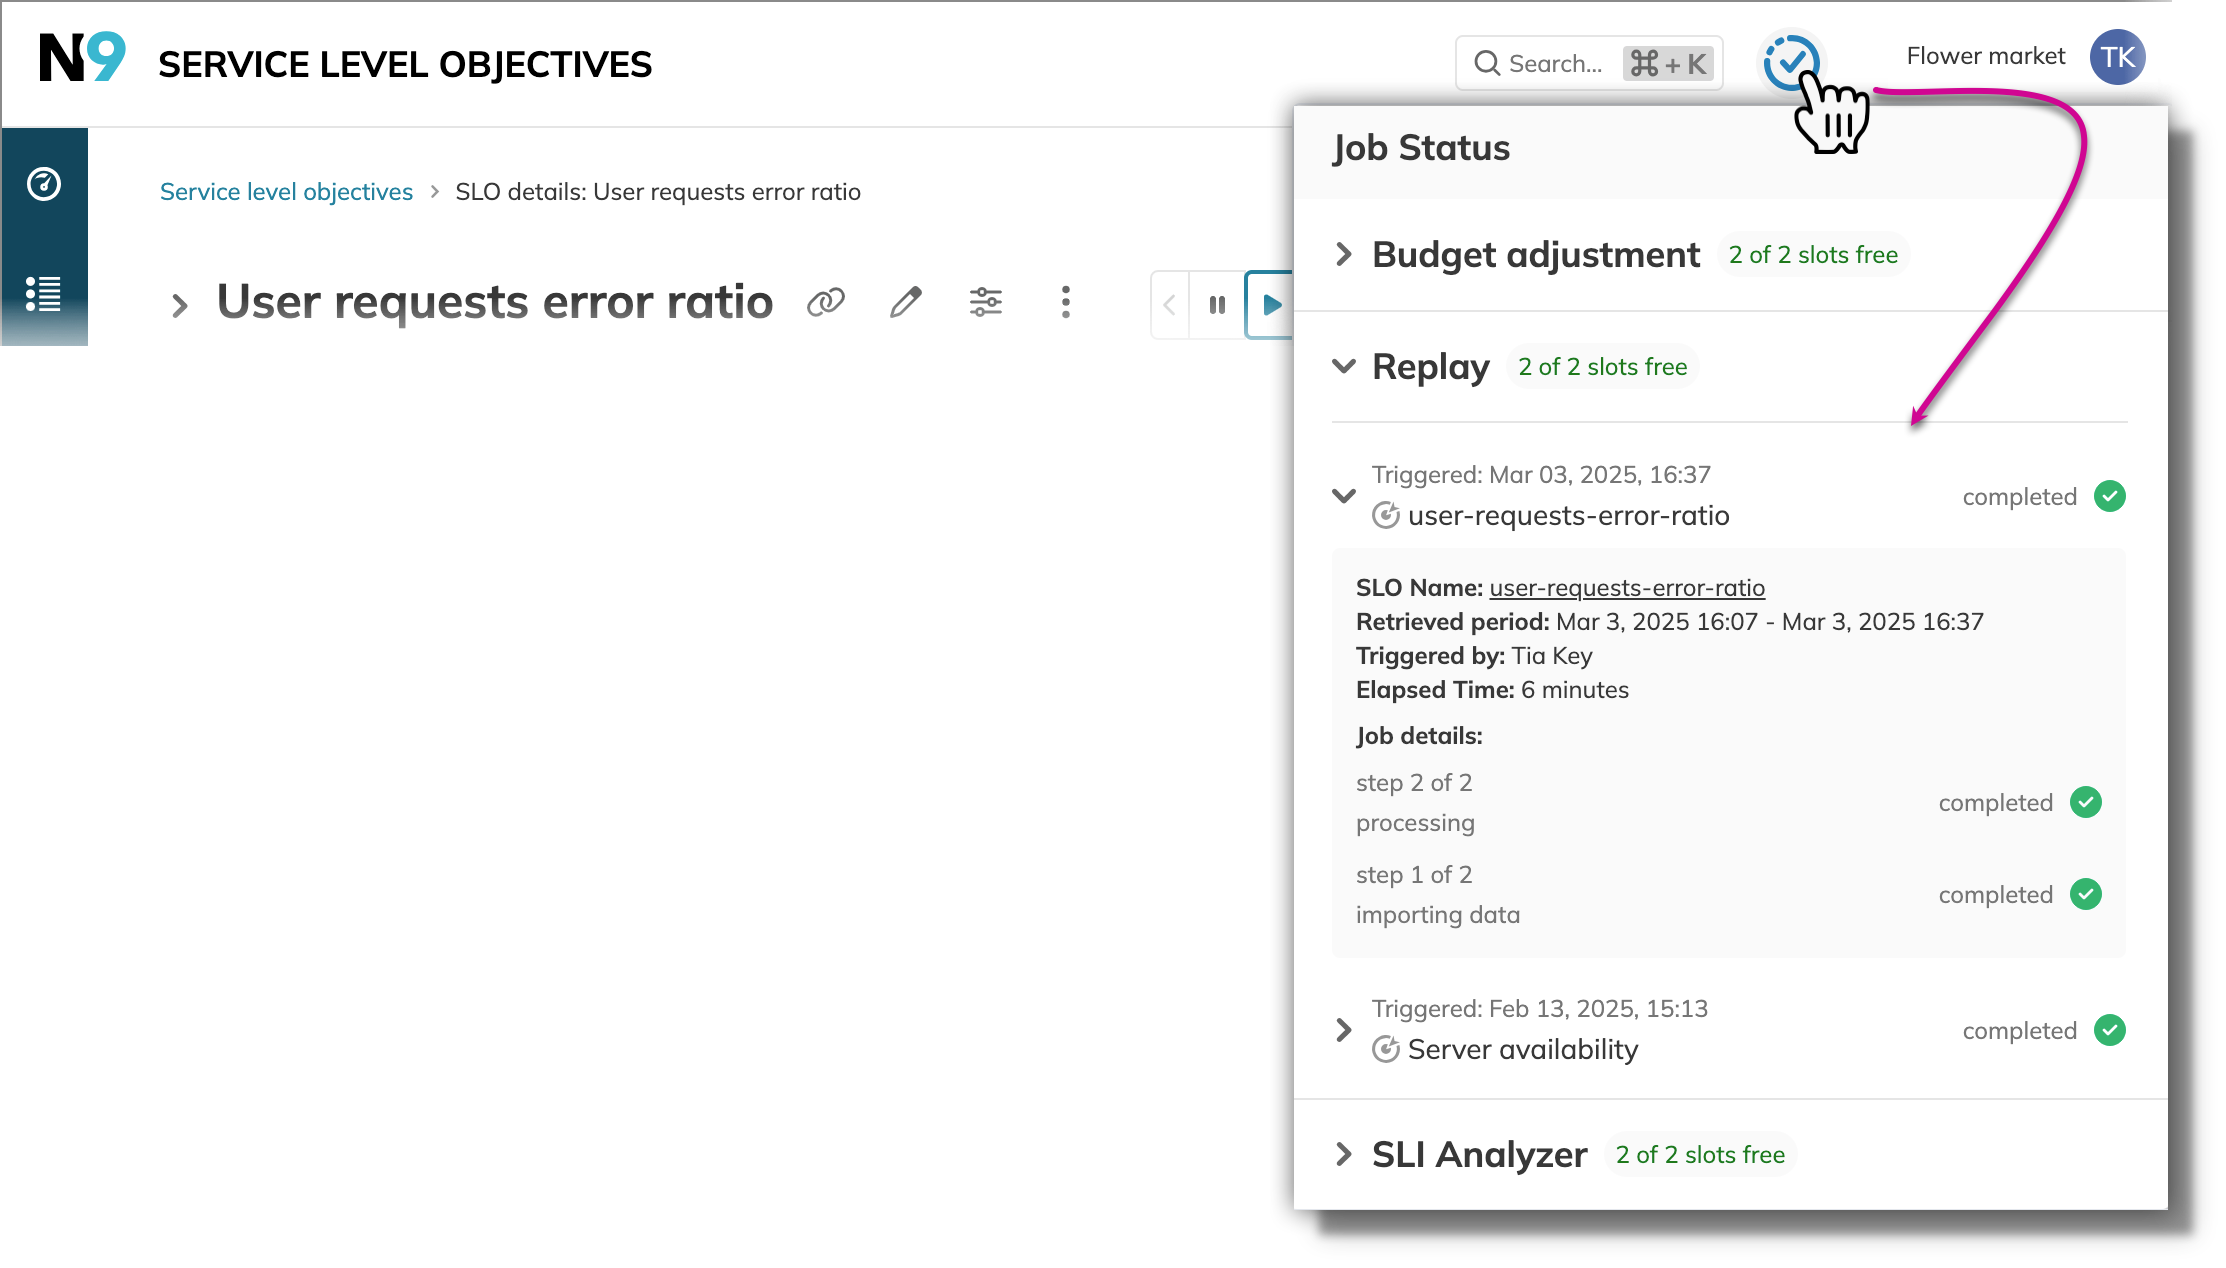
You can track the progress of the ongoing SLI analyses in the Job Status widget.
To access it, click next to the top right of the Nobl9 application:

- The widget displays the 3 most recent SLI analyses (the limit for concurrent SLI analyses +1).
- All jobs are sorted by status (
in progressalways takes precedence) and last triggered date, with the most recent date displayed at the top.
Create SLO from analysis
Once you've determined the right target using the available data, you can create an SLO using prepared parameters.
You can do so on the Nobl9 Web or using sloctl.
For this, open your required analysis page (must be in the Analysis complete status) and select either VIEW YAML or CREATE SLO:

- Nobl9 Web
- sloctl
- Click CREATE SLO.
The SLO wizard opens. Proceed with SLO creation steps:- Step 1: select a service for your new SLO.
- Step 2: the data source and metric settings are prefilled with the values selected in the analysis.
However, you can modify them. - Step 3: define the time window: select Rolling or Calendar-aligned.
- Step 4: the budgeting method, target, and values are prefilled after the analysis as a first objective in the SLO.
- Provide a unique Name for this SLO objective.
- Step 5: specify your SLO name and optional SLO attributes.
- Link is prefilled with the SLI analysis link.
- Click Create SLO
Nobl9 generates the YAML configuration with settings populated from the selected analysis.
- Click VIEW YAML.
- Copy the YAML configuration. Specify the required SLO and service names in the placeholders.
- Run
sloctl apply -f %your-slo-name%to apply this YAML file usingsloctlto create the SLO you configured.

