Service level objectives
Our services may be small or incredibly deep and complex, but almost without fail these services can no longer be properly understood via the logs or stack traces we have depended on in the past. With this shift, we need not just new types of telemetry, but also new approaches for using that telemetry.
A Practical Guide to SLIs, SLOs & Error Budgets by Alex Hidalgo
The core concept of performance tracking is a service level objective (an SLO). It refers to the desired performance of your service—the level you consider acceptable. In other words, you use SLOs to measure the reliability of your service.
SLOs exist along with two other concepts:
- Service level indicators (SLIs or objectives)—a quantifiable metrics that measure a specific aspect of your service's performance level.
Assessing your service performance, you monitor whether your SLIs satisfy your SLO. - Error budget—the acceptable number of failures you can have while still achieving your desired performance target.
It shows how close your reliability is towards your SLO over some period of time.
Considering the above-mentioned, an SLO unit refers to the number of unique error budgets Nobl9 calculates using the following:
- Data received from your data source
- Your configured target
This means every SLO is connected to a data source and has at least one error budget. Every additional SLO target is considered an additional error budget.
Nobl9 simplifies SLO development and management with its comprehensive features, from integrating your preferred data source, through SLO creation, to alerting and reports.
Using SLOs, you measure individual aspects of your service—the latency of authorization, the number of successful registrations, or anything else you need to monitor.
When you need to monitor the reliability of your complex system end-to-end, you can assemble multiple SLOs into a single composite.
Create an SLO
Nobl9 lets you create SLOs in the following ways:
- On the Nobl9 Web:
- Following the steps in the SLO wizard accessible from the SLO grid
- Using SLI Analyzer
- Using the SLOs as Code tools:
SLO name (in contrast to its display name)
is a unique identifier of your SLO.
While you can edit an SLO's display name at any time,
its name cannot be edited on the Nobl9 Web once you save the SLO.
The only way to modify it is the sloctl get slos command in sloctl.
Configuring an SLO, you specify an SLI—a metric for Nobl9 to pull from your data source. Depending on your metrics source, it is specified as a query or a set of parameters.
For example, you can query the following:
| Service type | Ask for |
|---|---|
| A web service or API | HTTPS responses with 2xx and 3xx status codes |
| A queue consumer | Successful processing of a message |
| Serverless and function-based architectures | Successful completion of an invocation |
| A batch | Normal exit (for example, rc == 0) of the driving process or script |
| A browser application | Completion of a user action without yamlScript errors |
Create a composite SLO
You can assemble existing SLOs into a composite SLO to gain a unified view of your system's reliability and performance. This approach streamlines reliability monitoring by assessing individual components from a single entry point. It provides a consolidated perspective, event for complex systems with diverse components, data sources, reporting frequencies, and criticality levels.
Refer to the Composite SLOs guide for step-by-step instructions.
The Nobl9 Terraform provider documentation and YAML guide provide the details on how to create composite SLOs leveraging the SLOs-as-code approach.
SLO grid
Once created, your SLO appears in the SLO grid, in the Service Level Objectives section on the Nobl9 Web.
This is a central board of your SLOs. You can do the following:
- View all SLOs in the organization.
You can see SLOs enclosed in projects you have access to. - Search and filter SLOs.
- View live SLO charts, rewind them, fast-forward up to the current time, and pause.
When a time window is paused or set to a past period, the Error budget remaining and Burn rate values aren't displayed. Resume time window live update to view these values. - View SLO charts from the perspective of different time windows and time zones
Any changes to the time zone made on the SLO grid apply to this SLO details page.
If you suspect an issue with an SLO, first verify its underlying query. For queries that seem accurate, the problem might lie with the data source itself. In that case, activate event logs for your data source to pinpoint errors and identify the number of impacted SLOs.
SLO details
Click the required SLO to open its details. Here you can manage and assess your SLO.
The following options are available in your SLO header row:
| Button | Action | Notes |
|---|---|---|
| Expand SLO metadata | SLO metadata includes the following: | |
| Copy link to the SLO | Link is copied along with the time window and time zone | |
| Edit the SLO | SLO wizard opens | |
| Open the Options menu | ||
| Open the More actions menu |
1Charts settings apply to all SLOs per user. Once you set the chart visibility for one SLO, you'll see the same for all SLOs. When no chart is selected, the message Select at least one chart to see data appears in place of charts.
2Run Replay is inactive while it's being replayed or when the maximum period for historical data retrieval is set for its data source to 0.
You can also handle the time window parameters:
- Shift SLO time window, change the time zone, and copy the time window
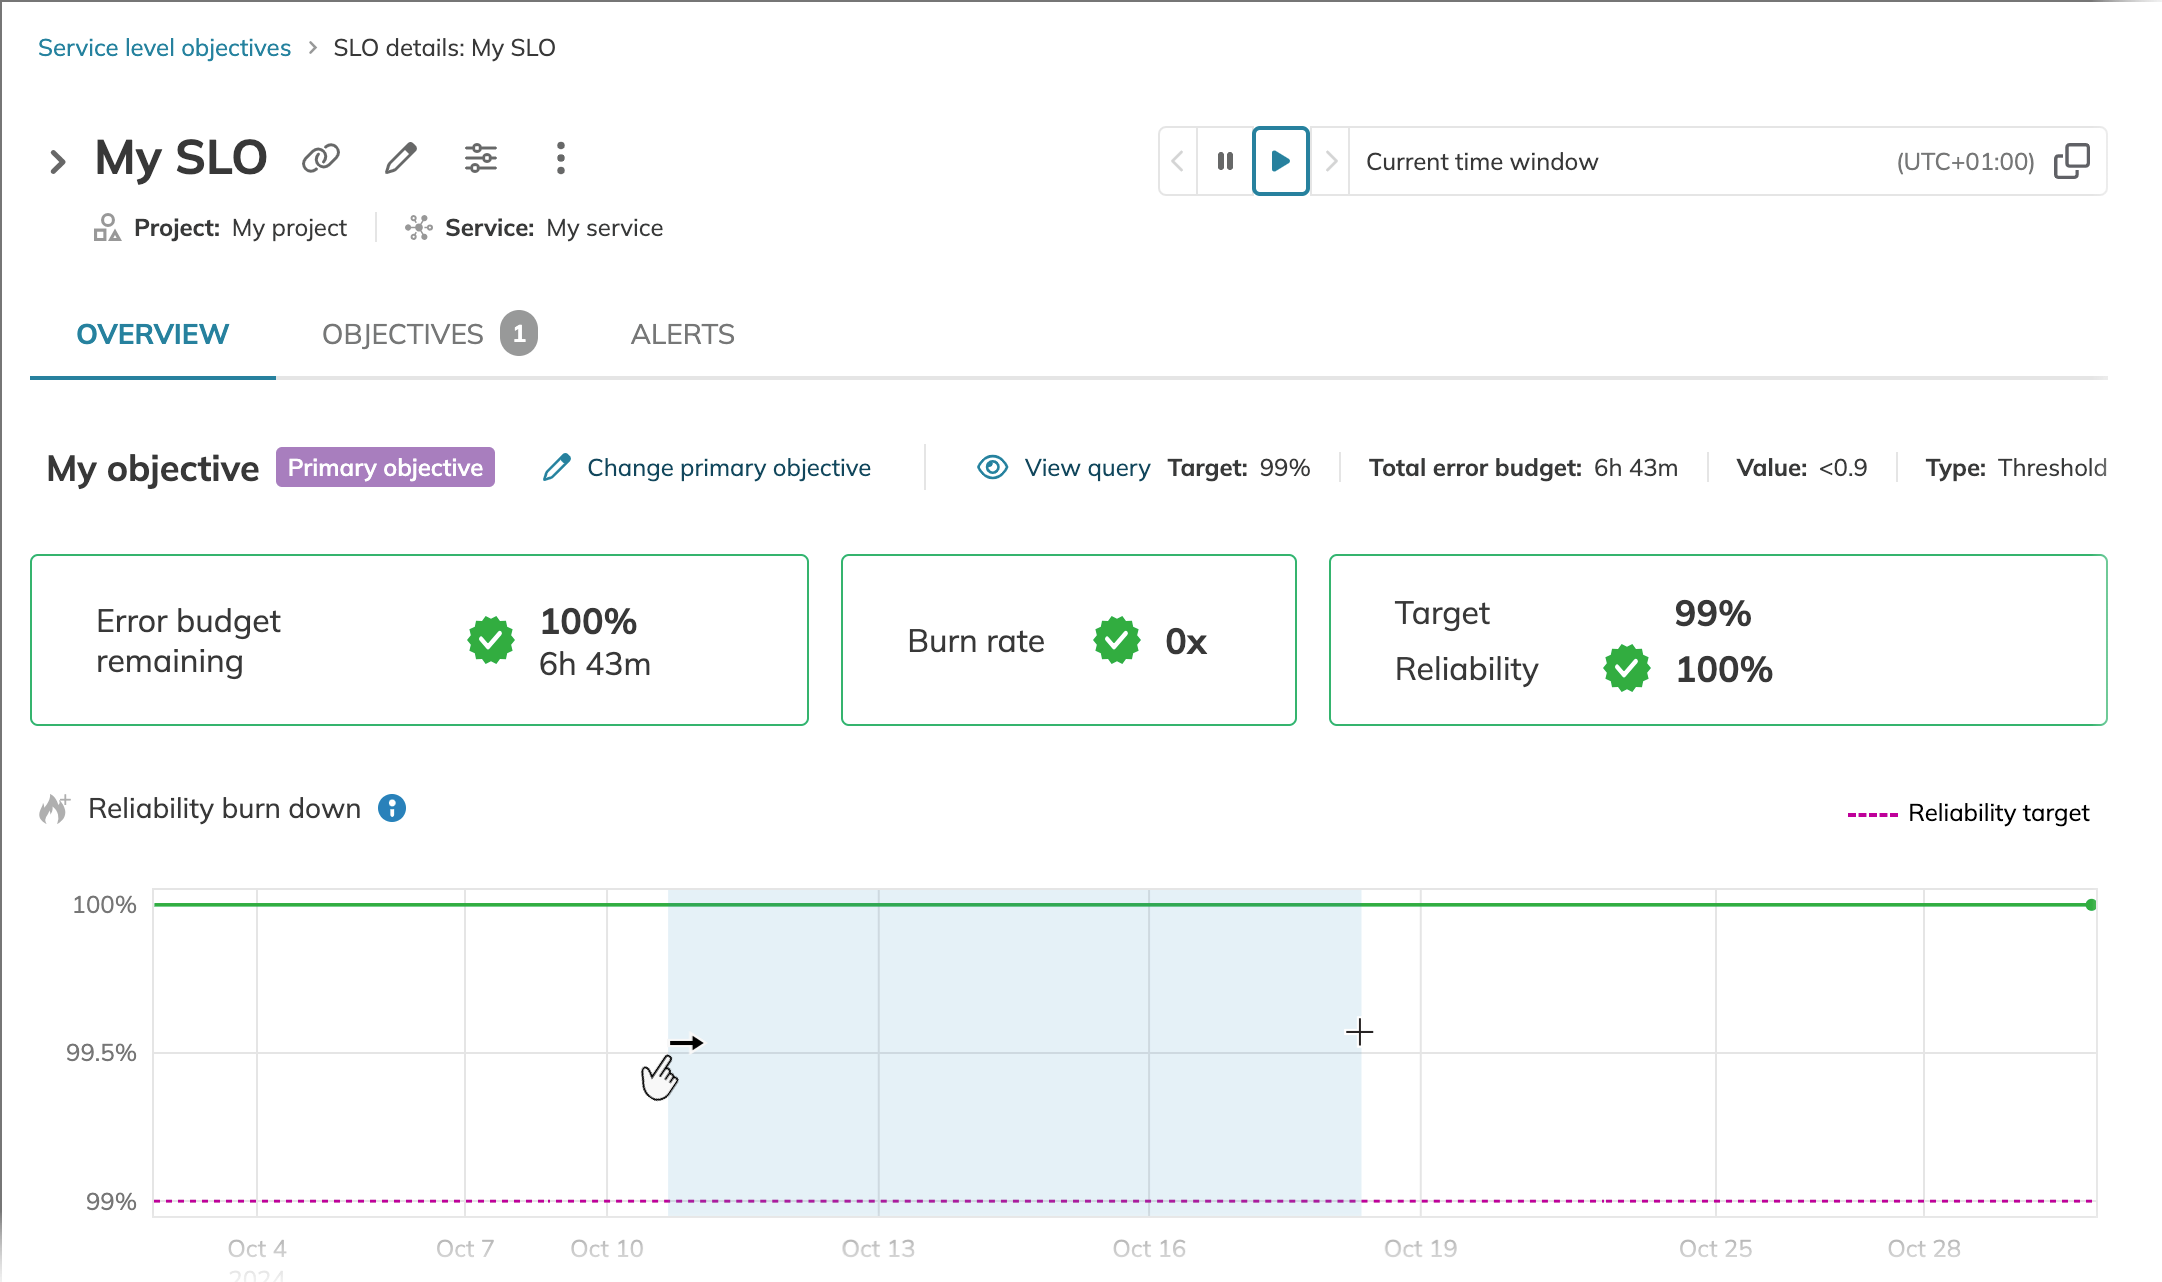
The default time zone matches the time zone set in SLO grid - Zoom in SLO charts to access SLI raw data
To zoom in on a specific time range, click and drag on the desired area of the chart. You can drag in both directions.
Highlights
The SLO details page comprises five tabs. They organize the focus areas of your SLO and are as follows:
- Overview focuses on the primary objective
- Objectives contains summaries and charts for all objectives in your SLO
- Alerts comprises your SLO-related alerts
- Change history shows the history of changes made to your SLO
- Annotations displays annotations added to your SLO
Once you open the SLO details, you land on the Overview tab. It highlights the reliability values and charts of the primary objective of your SLO.
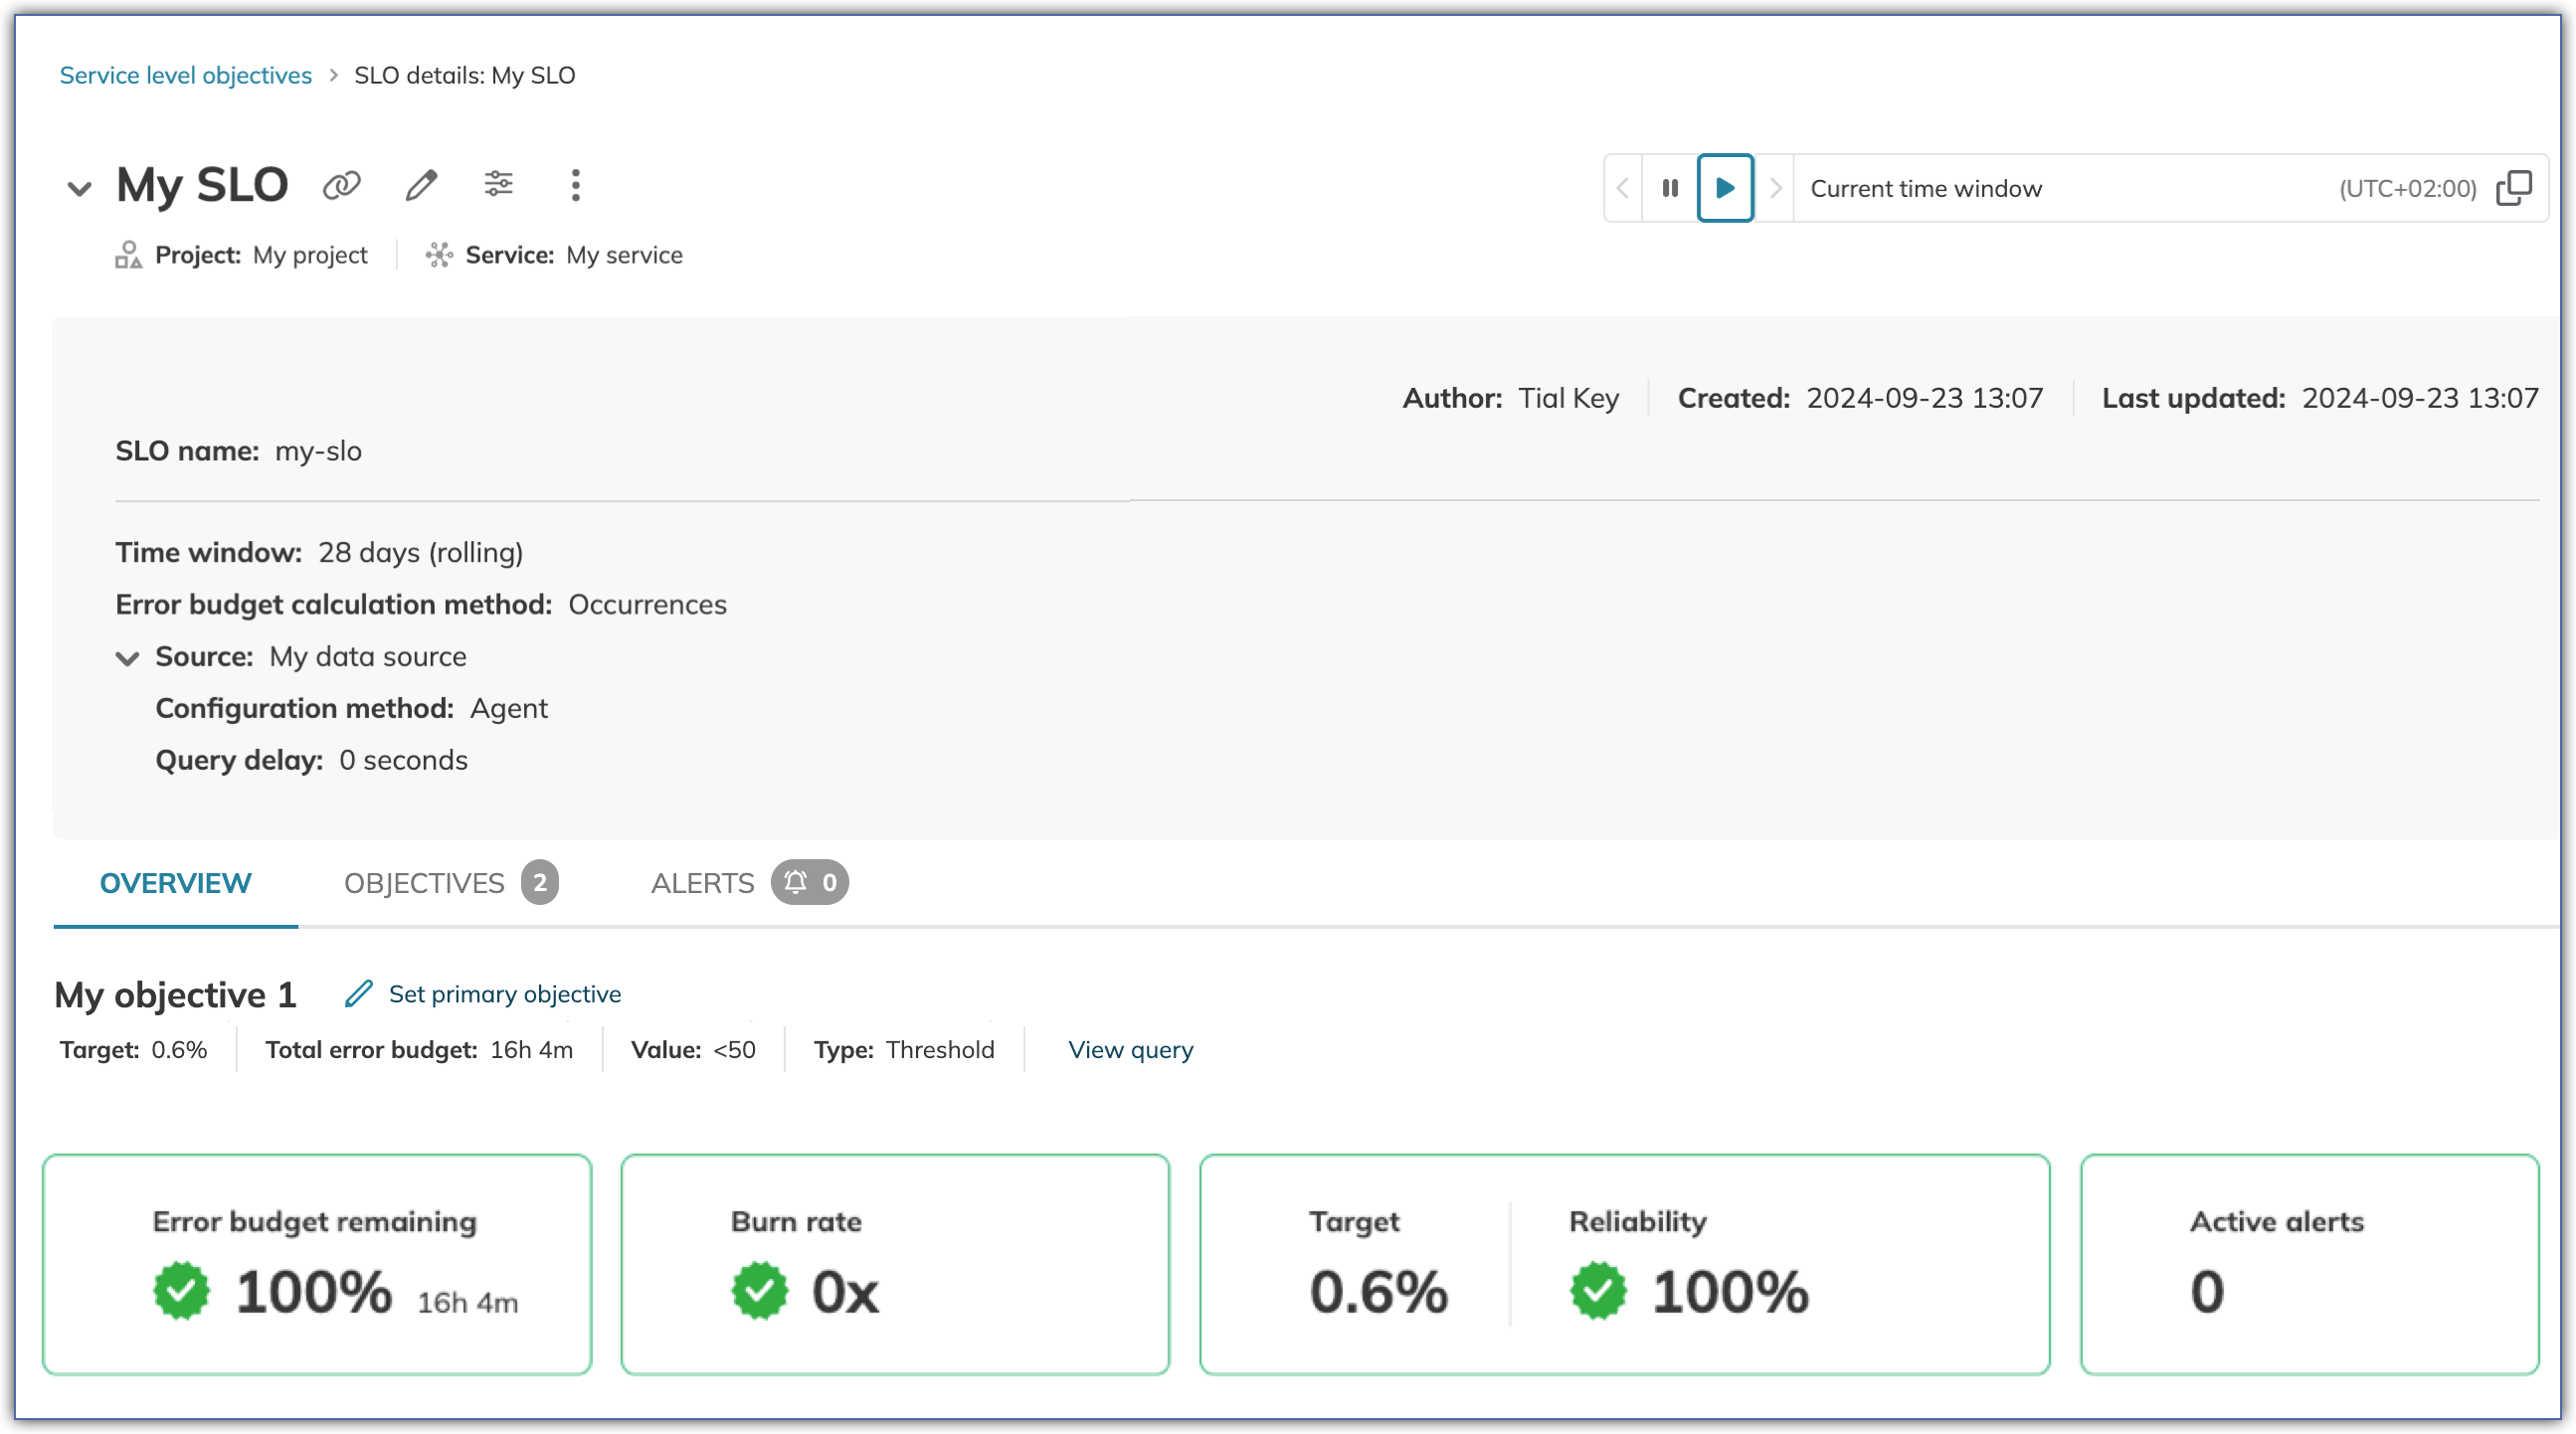
The primary objective is an objective that takes center stage on the SLO details page.
You can access its detailed information
immediately
upon opening your SLO details.
The primary objective is labeled with
The tiles on the Overview and Objectives tabs display the reliability values of your objective that is currently in focus. The tiles provide a snapshot of the most recent data, focusing on the last seven days of the chosen time window. Here, you can find the following:
- The error budget remaining (in percent)
- The burn rate
- The reliability target, along with the current reliability value
- The number of active alerts within the current time window
Below the tiles, the charts visualize the reliability parameters of the objective currently in focus. The charts cover the entire time window selected and include the following:
- The error budget remaining
- The reliability burn down
- The service level indicator
- The error budget burn rate
The SLI chart visualizes the data points received. Its appearance varies depending on the metric type (threshold or ratio). For ratio metrics, the chart's appearance also depends on the data count method. Non-incremental ratio metric charts feature two key elements:
- The option to select the display mode
- Counts of good (or bad) and total events received over the selected time window
Wider time windows show aggregated (downsampled) data, where the aggregation method is also determined by the metric configuration.
Read more about SLI aggregations.
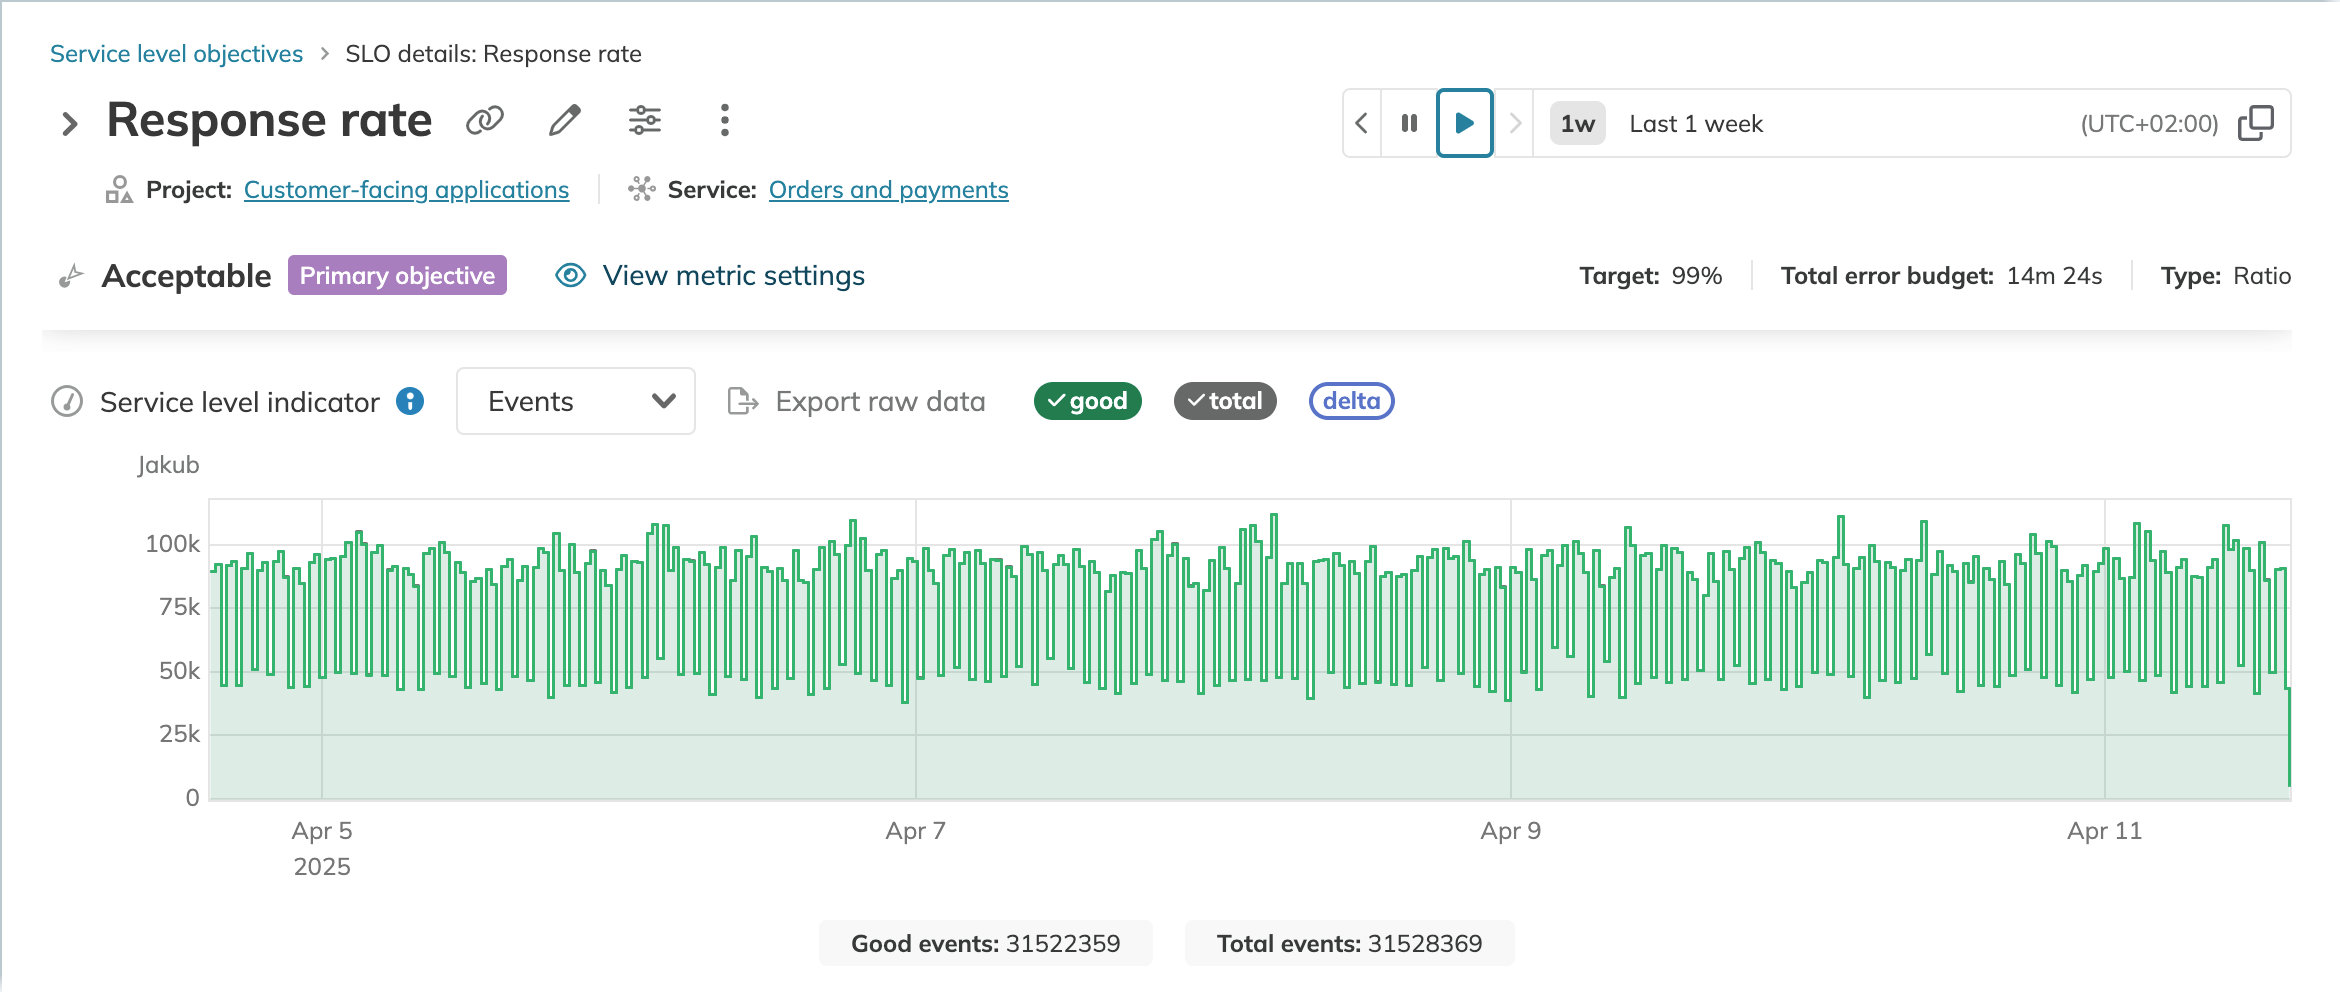
Under every objective name, you can find its summary:
- Target: the percentage of acceptable performance you're aiming for.
- Total error budget shows how much of the error budget this objective has within the time window.
- Value indicates which values you considered acceptable for this objective using one of the indicators: less than, less than or equal to, greater than, greater than or equal to.
- Type: the metric type—ratio or threshold.
You can also view objective's underlying metric settings.
To access general SLO metadata, click (unfold) before the SLO name.
The metadata block includes the following:
- Parent project, service, and data source
- SLO history: who created this SLO and the dates of creation and last update
-
For newly created SLOs, and when no primary objective is set for an SLO, Nobl9 displays the lowest-target objective under the Overview tab.
-
The reliability target always shows the actual value, regardless of the time window selected.
-
The Active alerts tile always shows the real-time number of active alerts.
Pausing the SLO also pauses the live updates of active alerts. In this case, the tile shows alerts that were active at the moment of pausing. -
For time windows shorter than seven days, the tiles and charts capture the entire time window.
-
Reliability target changes.
Values in both tiles are calculated based on the most recent data within the time window selected.
Since the Target value is always an actual target, if you increase it, there can be a moment when the Reliability tile is red even with the sufficient value and enough error budget remaining in percent. And vice versa: the reliability can be too low, and the error budget very little, but the Reliability tile can turn green if you decrease the target low enough.
This can happen for a relatively short time after reliability target modification because Nobl9 recalculates the values in both tiles, considering the new target, after the following data income.
This time range remains in SLO history, so when you rewind the time window, you will still see it unless you change the target again or replay1 the SLO.
1The maximum period for historical data retrieval limit per data source is applied.
SLO alerts
This tab provides the details of alert policies linked to your SLO along with any triggered alerts.
The number next to the tab name indicates how many alerts are currently active.
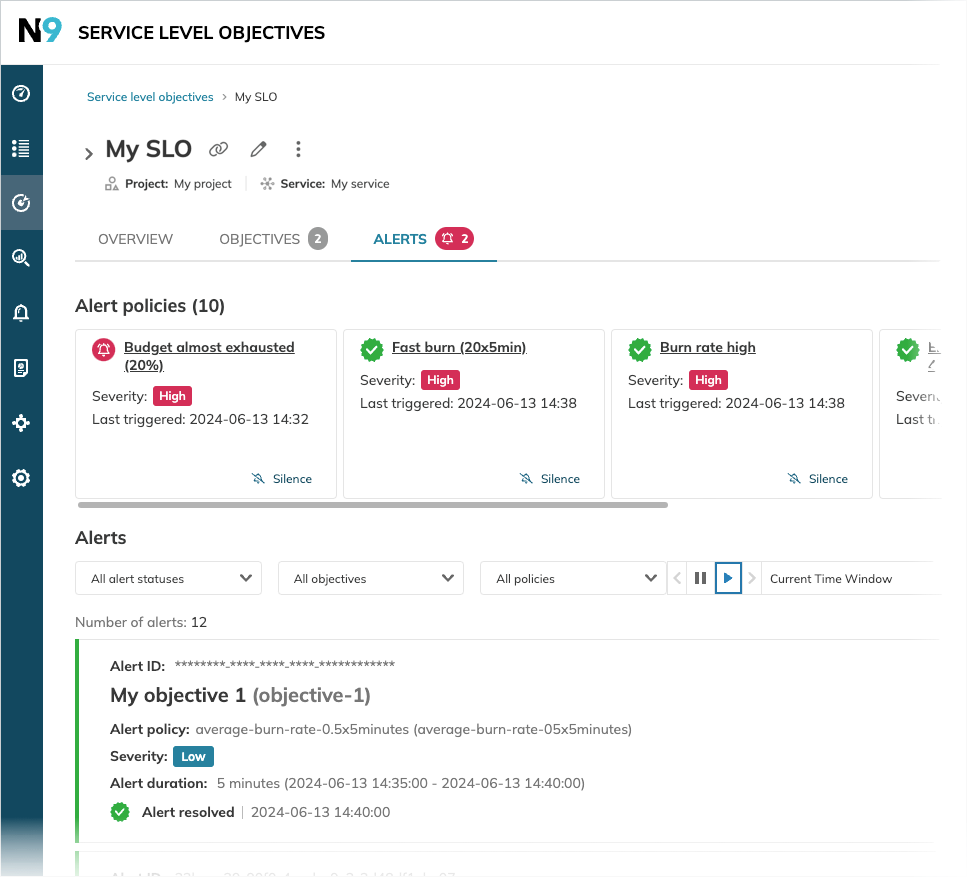
Tiles display the alert policies linked to your SLO and their summary
- The alert policy name and severity
- Whether it triggered any alerts for this SLO and when, if yes
- The option to silence or resume alerts
Depending on alert status, alert policies are marked as follows:
| Status | Description |
|---|---|
| Currently alerting | |
| Alert resolved | |
| Alert silenced | |
| No icon | No alert triggered |
To silence an alert policy, click Silence in its tile. The policy you originally intended to silence is marked for silencing. Select the silence duration and click Silence to confirm.
Under the Silenced alerts section, the currently silenced alerts are listed. You can resume currently silenced alerts, silence any other alerts, or resume all alerts at once.
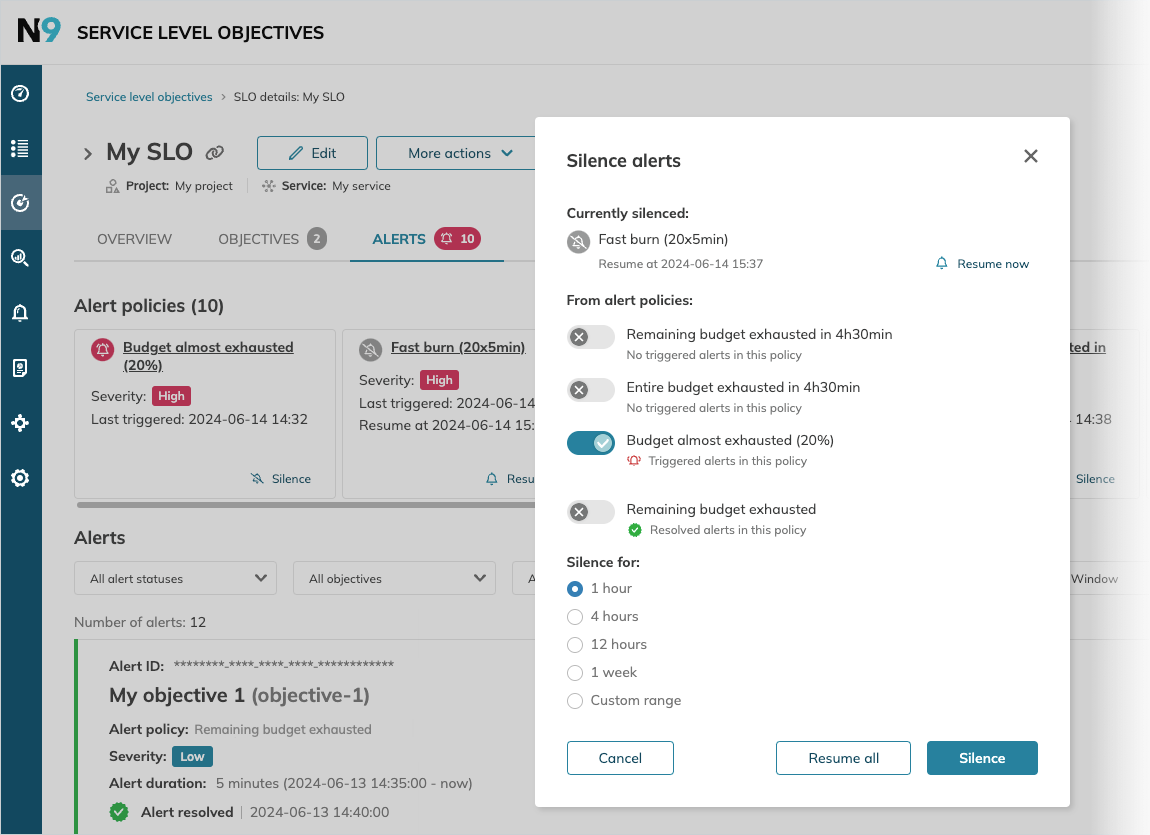
Under the tiles, the Alerts list shows alerts triggered per SLO objective. Nobl9 limits displaying alerts to 1000 most recent alert events. Click the required alert to open its details.
By default, you see alerts that have been active within the SLO's current time window. The newest alerts are displayed first.
You can filter the list by the following criteria:
- Alert status: All alerts, Triggered, Resolved
- SLO objective name
- Alert policy name
- Time window
When you filter by two or more criteria, the results satisfy all of them—Nobl9 applies the AND logical operator.
Nobl9 only shows alerts for SLOs, services, and alert policies that currently exist. Alerts will no longer be available if:
- The associated SLO, service, or alert policy is deleted (even if it's recreated later with the same name).
- The alert policy is unlinked from the SLO
Managing SLOs
SLO management options in Nobl9 include copying existing SLOs. For this:
-
Go to your required SLO details.
-
Click
(more actions) > Copy SLO.
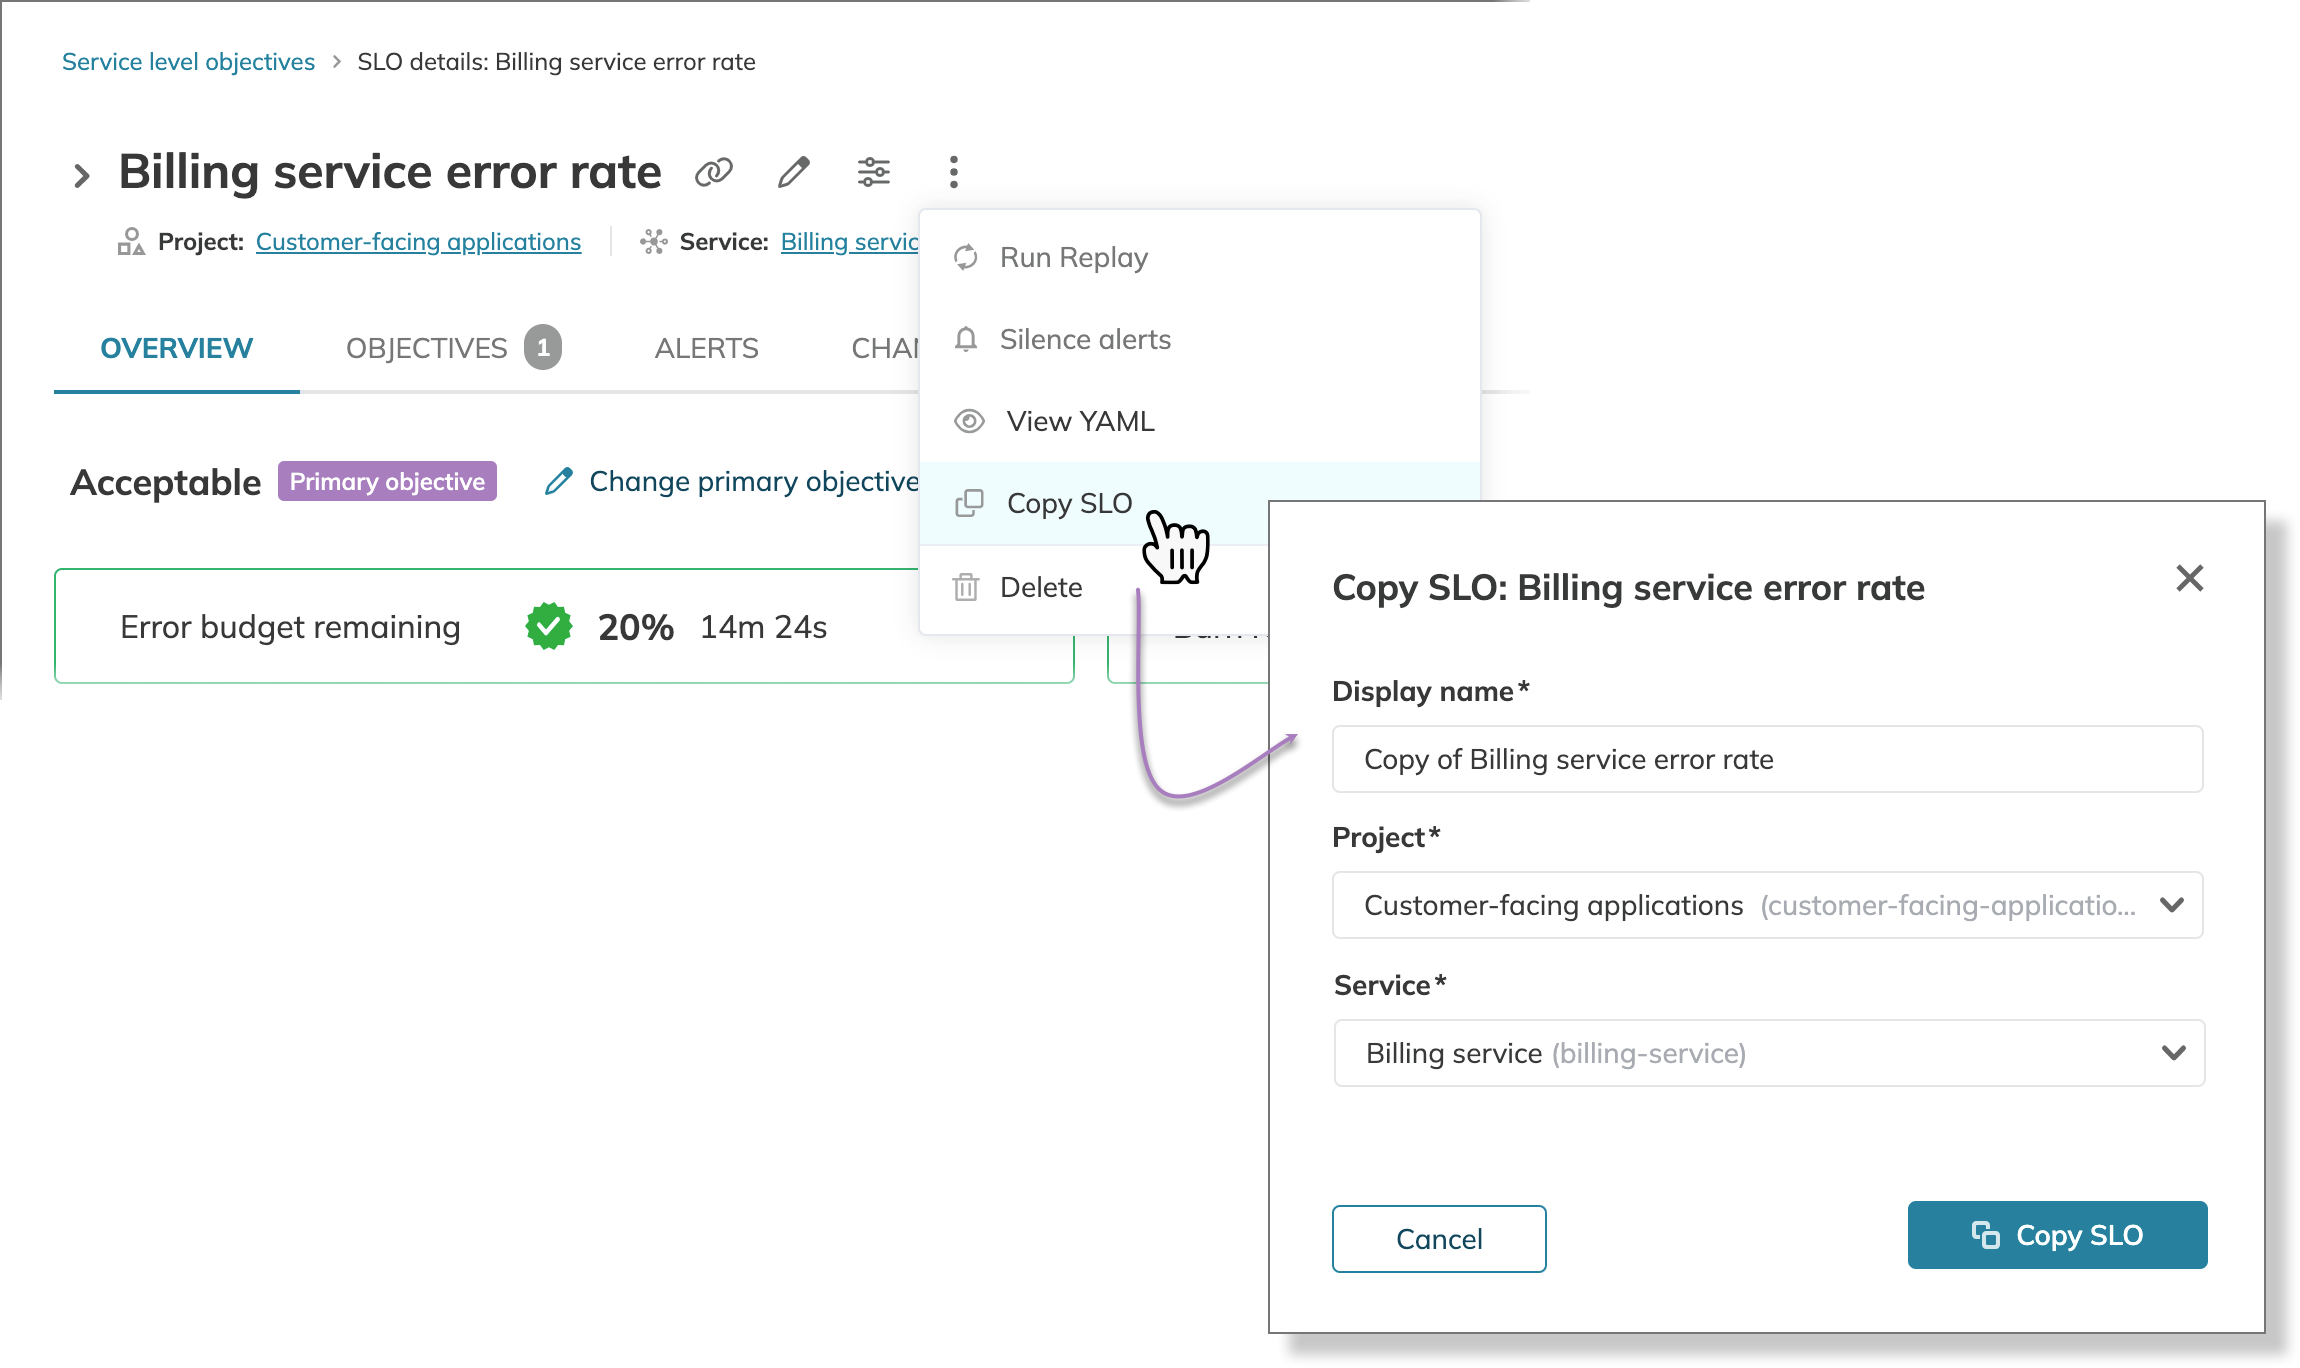
Copying SLO -
Make the necessary amendments: modify your copy name, select the required project and service.
Copying the SLO to a different project requires service selection. Make sure your required project contains at least one service. -
Click Copy SLO to confirm.
| Configuration from the original SLO | Is copied? | Notes |
|---|---|---|
| Always copied | Data collection mirrors the original SLO. | |
| Collected data | Never copied | Starts new data collection upon creation. |
| Alert policies | Depends on copy's destination | Retained if copied within the same project (any service); otherwise, unlinked. |
| No data anomaly alert methods | Depends on your permissions to alert methods' projects | Preserved if you have access to these projects; otherwise, unlinked. |
Useful links

 The key to reliabilityNobl9 blog
 SLO inputs and outputsSLOs
 Use case of SLO configurationUse cases
 Creating SLOsData sources in Nobl9
 SLO Terraform configurationNobl9 Terraform provider
 SLO creation assistanceSLI Analyzer
 Composite SLOsComposites
 SLO annotationsNobl9 features
 SLI aggregationsSLO guides
 Error budgetGlossary
 AlertingAlerting
 Alert conditionsAlerting
